Our Tableau Journey
What?
Figmd Executives came to the FIGX team, seeking to reinvent the way they visualised their Registry reporting. The aim of the report was to capture a periodic summary of selected registries. It was built for the internal & external audience.
The executives introduced Tableau to FIGmd as a means to analyze and govern data on a selected set of business reports and scenarios to help in decision making. As like other tools, Tableau also had its limitations and strengths. Comparatively it holds more value in handling complex data from and providing relatively quick data visualizations.
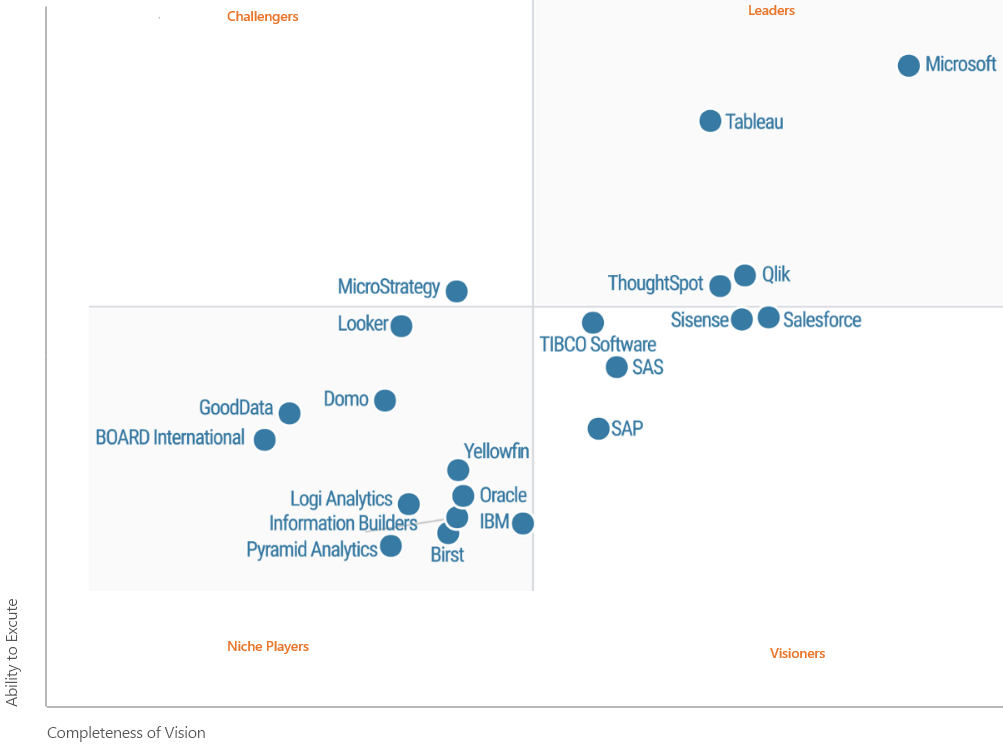
Why Tableau? Where does Tableau stand?
As like other tools, Tableau also had its limitations and strengths. Comparatively it holds more value in handling complex data from and providing relatively quick data visualizations.
.png)
Other organizations have been actively using Tableau as their major Data Analysis tool for the majority of the reports that have been developed in the past. In terms of the BI Landscape, FIGmd already had a few solutions in place with other BI tools.
Our previous reporting systems were based either on restricted BI tools or mostly on Excel Spreadsheets.
Creating reports in Excel was tiresome and required a team of 4 to 5 people for adoption to other divisions. In addition to this, the analytics team spent six to seven days creating one monthly report so, imagine what an overwhelming task it was to create reports for each Registry or for more.
The executives decided to introduce Tableau in FIGmd as a means to analyze and to create Reports for the selected set of business use cases and scenarios to help in decision making.
First Test of
Tableau - Payerhub

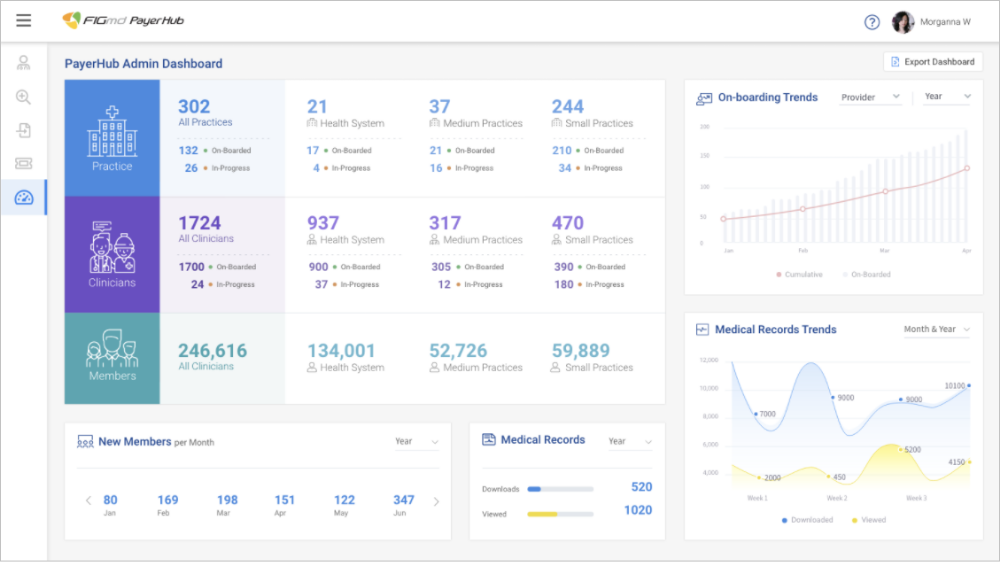
We chose Payerhub to try our hands on Tableau. It was a jump start approach to directly engage with tableau and start exploring its capability.
PayerHub Dashboard admin users to track Practice status and ongoing related statuses.
We did not design the dashboard as per Tableau capability for this pilot project, which led us to understand Tableau interaction limitations.
Process: Visual design, Direct Frontend integration with Tableau Learning : Understand Tableau UX pattern
So, How?
By Understanding Basics & not by jump starting
Our team met with the key stakeholders to address the exact needs of the reports. Once these were collated and finalized the pilot project began.
The Two Questions before you start any DataViz project:
- To start thinking visually, consider the nature and purpose of your visualization: Is the information conceptual or data-driven?
- Am I declaring something or exploring something?
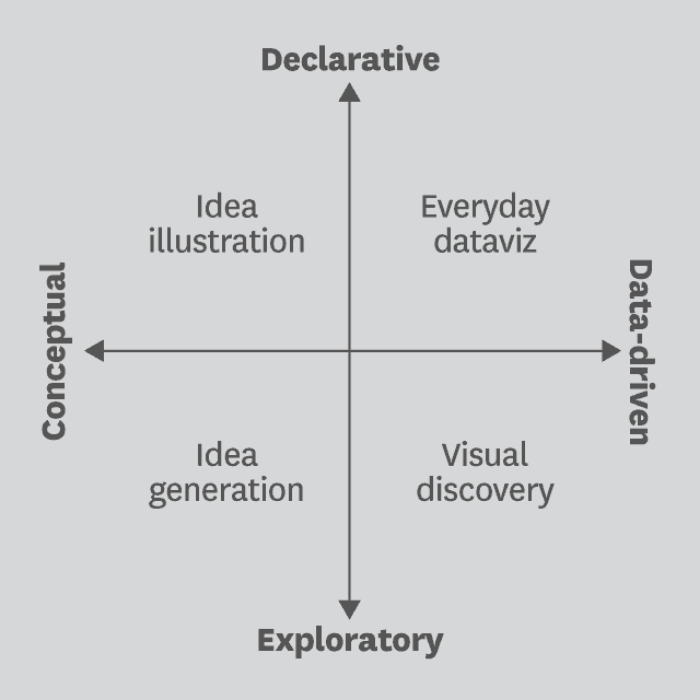
We had a blurred idea about our required DataViz placing amid Conceptual, Declarative, Data Driven & Exploratory. It was inclined towards the Visual Discovery corner.
Towards more clarity We also touched 2 important aspects of Data representation to achieve tangible solution which can provide visual Discovery
- Data Analytics
- Data Visualization
1. Data Analytics
The next challenge is to know more about the way we understand data & how it should be portrayed in the report. To do so, The four techniques in analytics may make it seem as if they need to be implemented sequentially.
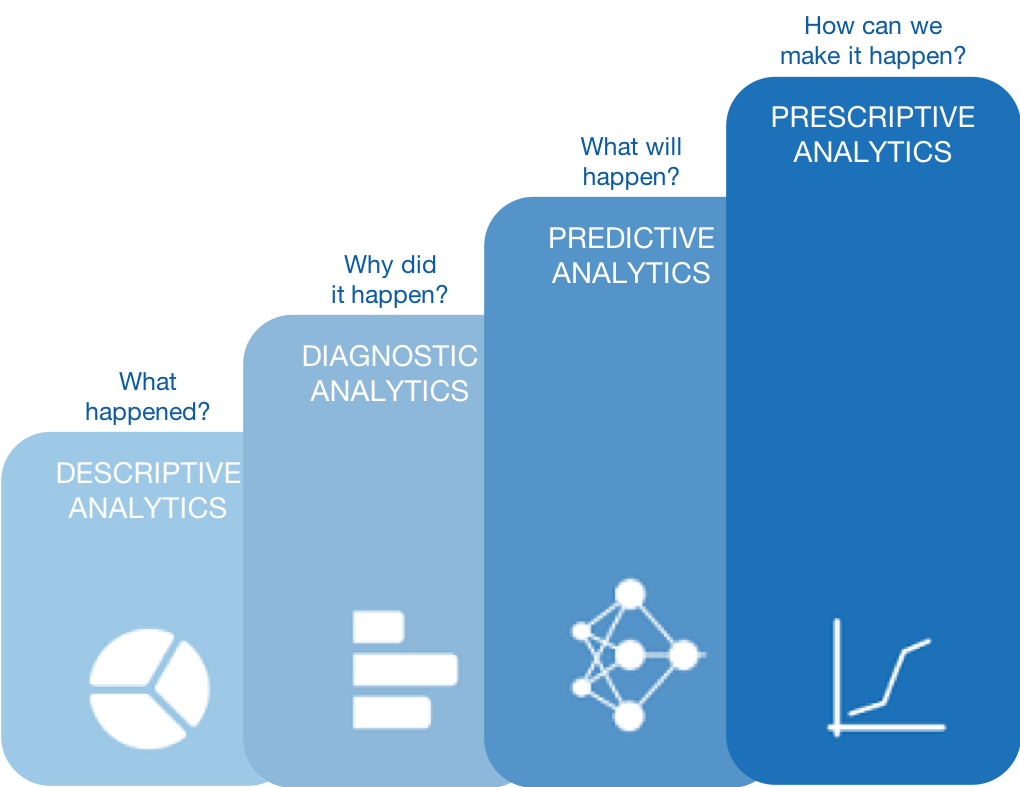
As for most Healthcare data companies, they are aware of or are already implementing descriptive analytics but if one has identified the key area that needs to be optimised and worked upon, they must employ prescriptive analytics to reach the desired outcome.
Descriptive Analytics:
Descriptive Analytics: Describing or summarising the existing data using existing business intelligence tools to better understand what is going on or what has happened.
Diagnostic Analytics:
Focus on past performance to determine what happened and why. The result of the analysis is often an analytic dashboard.
Predictive Analytics:
Emphasizes on predicting the possible outcome using statistical models and machine learning techniques.
Prescriptive Analytics:
It is a type of predictive analytics that is used to recommend one or more courses of action on analyzing the data.
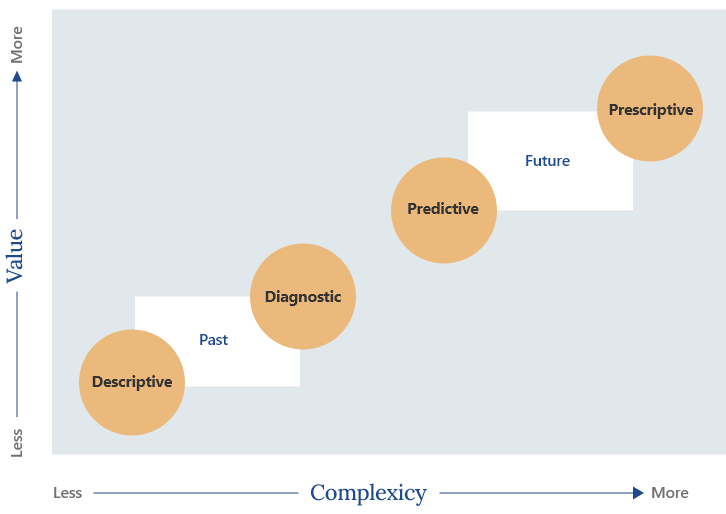
However, in our scenarios, we decided to stick to Diagnostic analytics with more accurate representation of complex data. As both Predictive Analytics & Prescriptive Analytics need concrete AI implementation.
2. Data Visualization
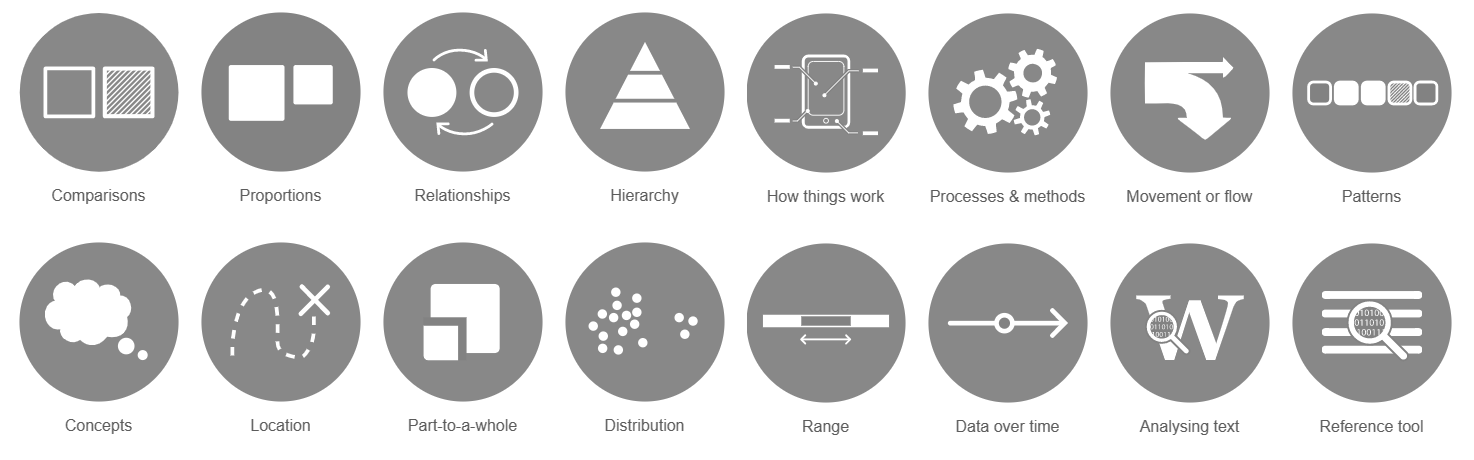
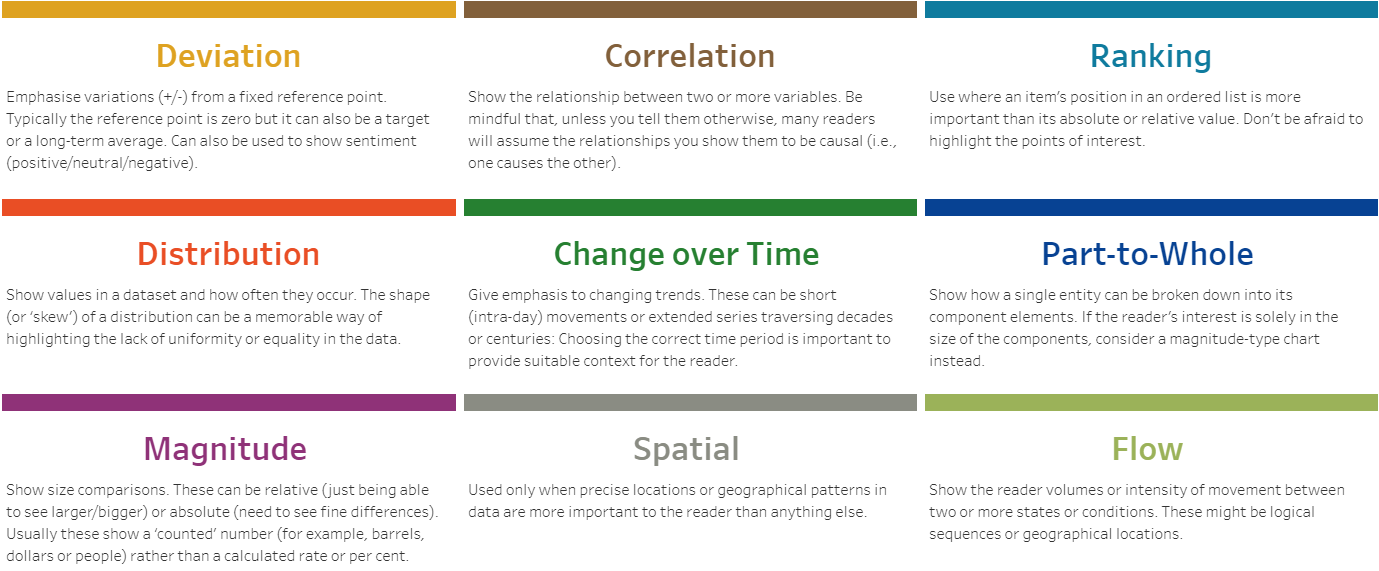
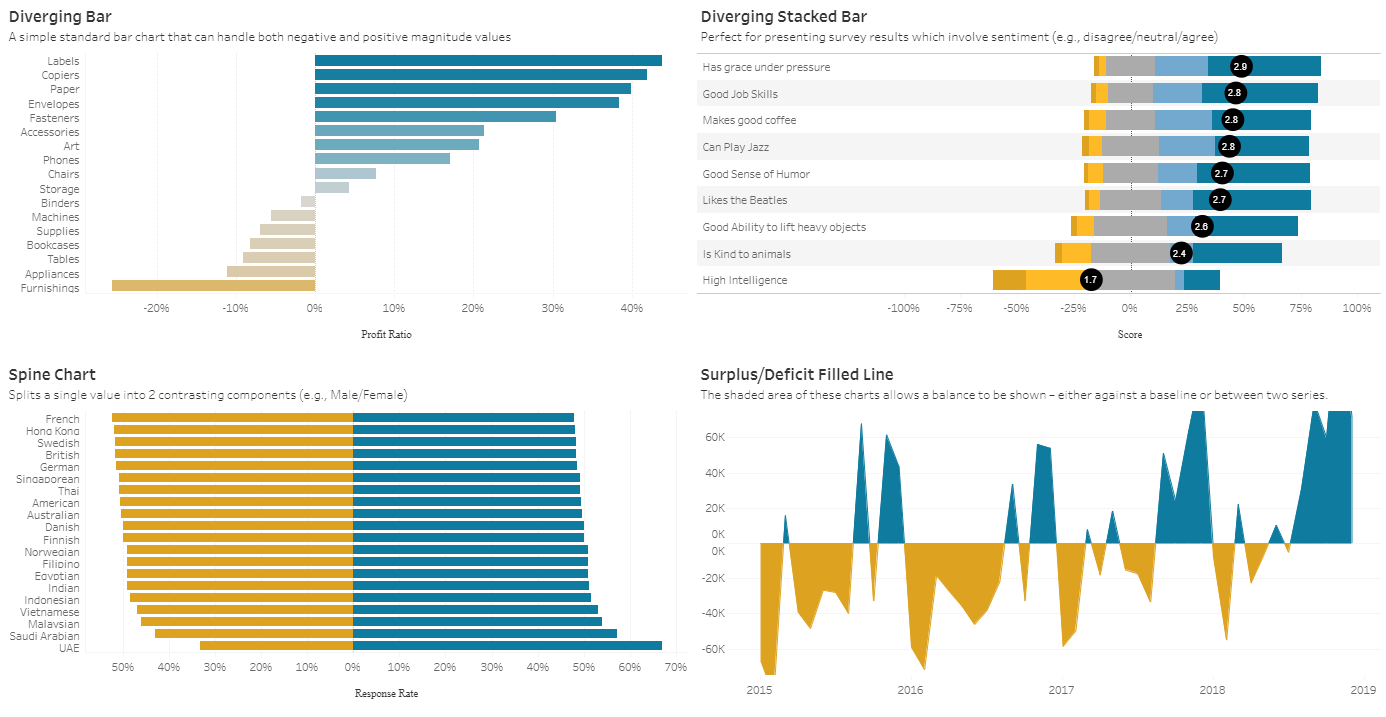
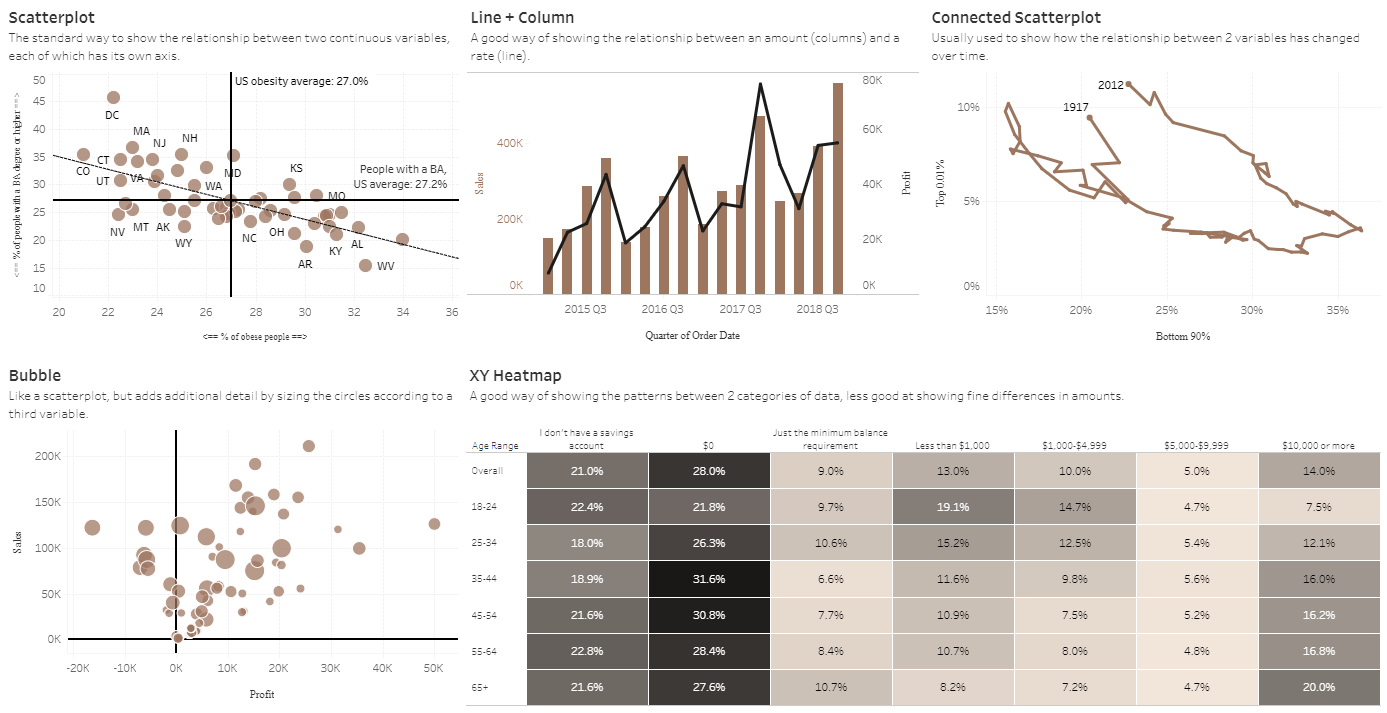
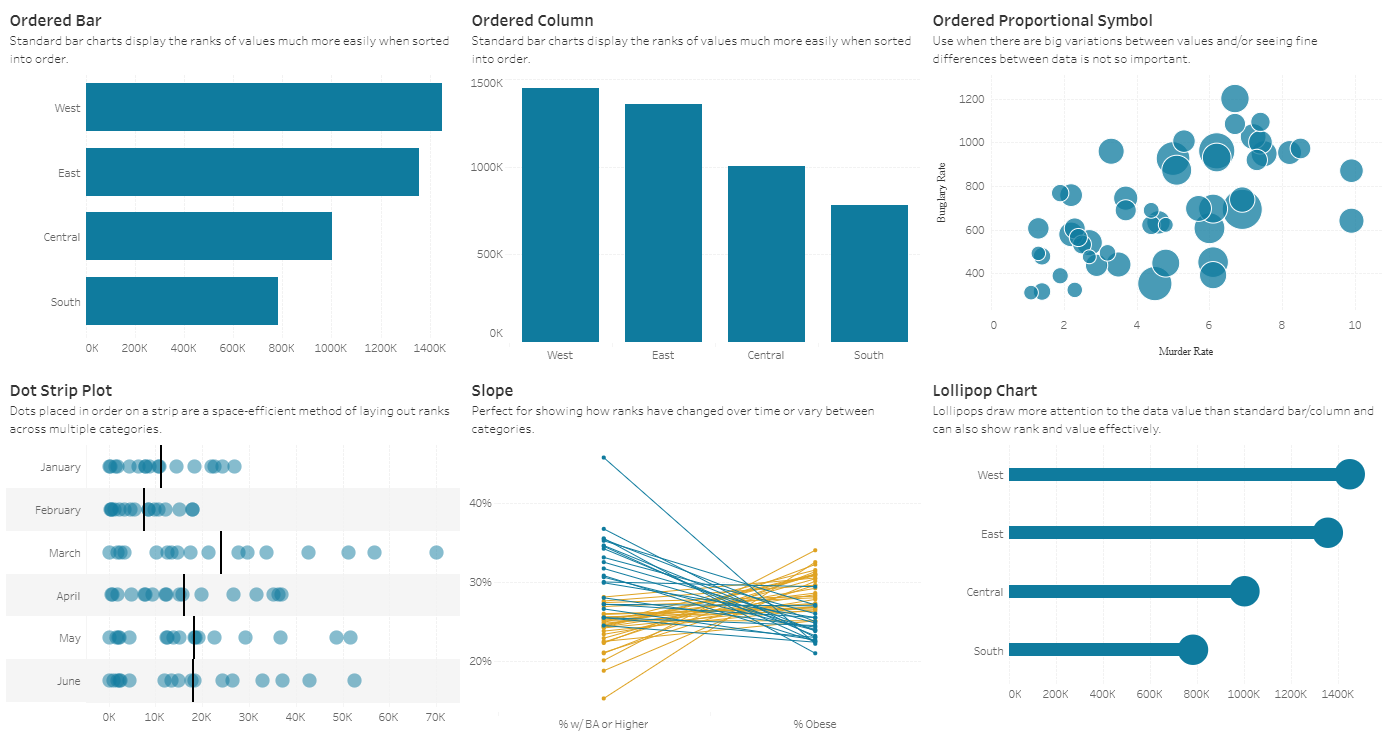
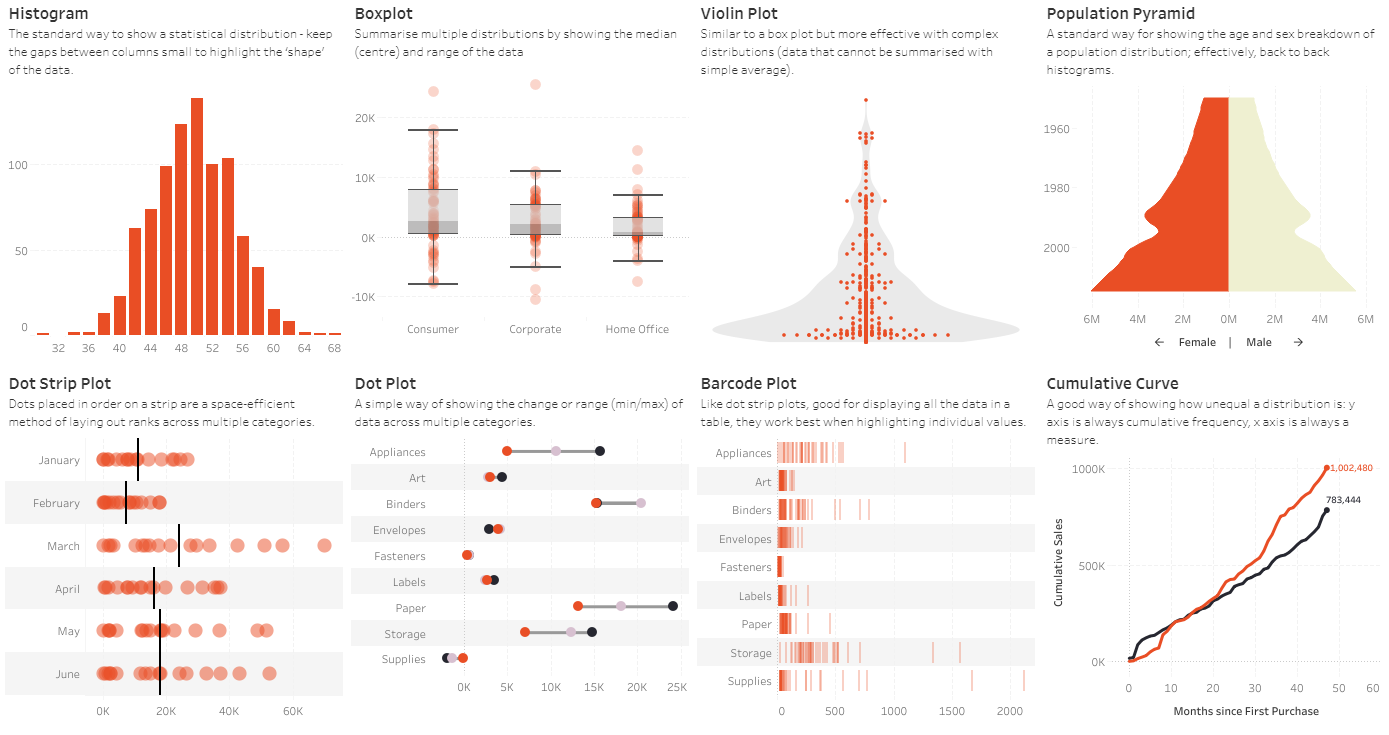
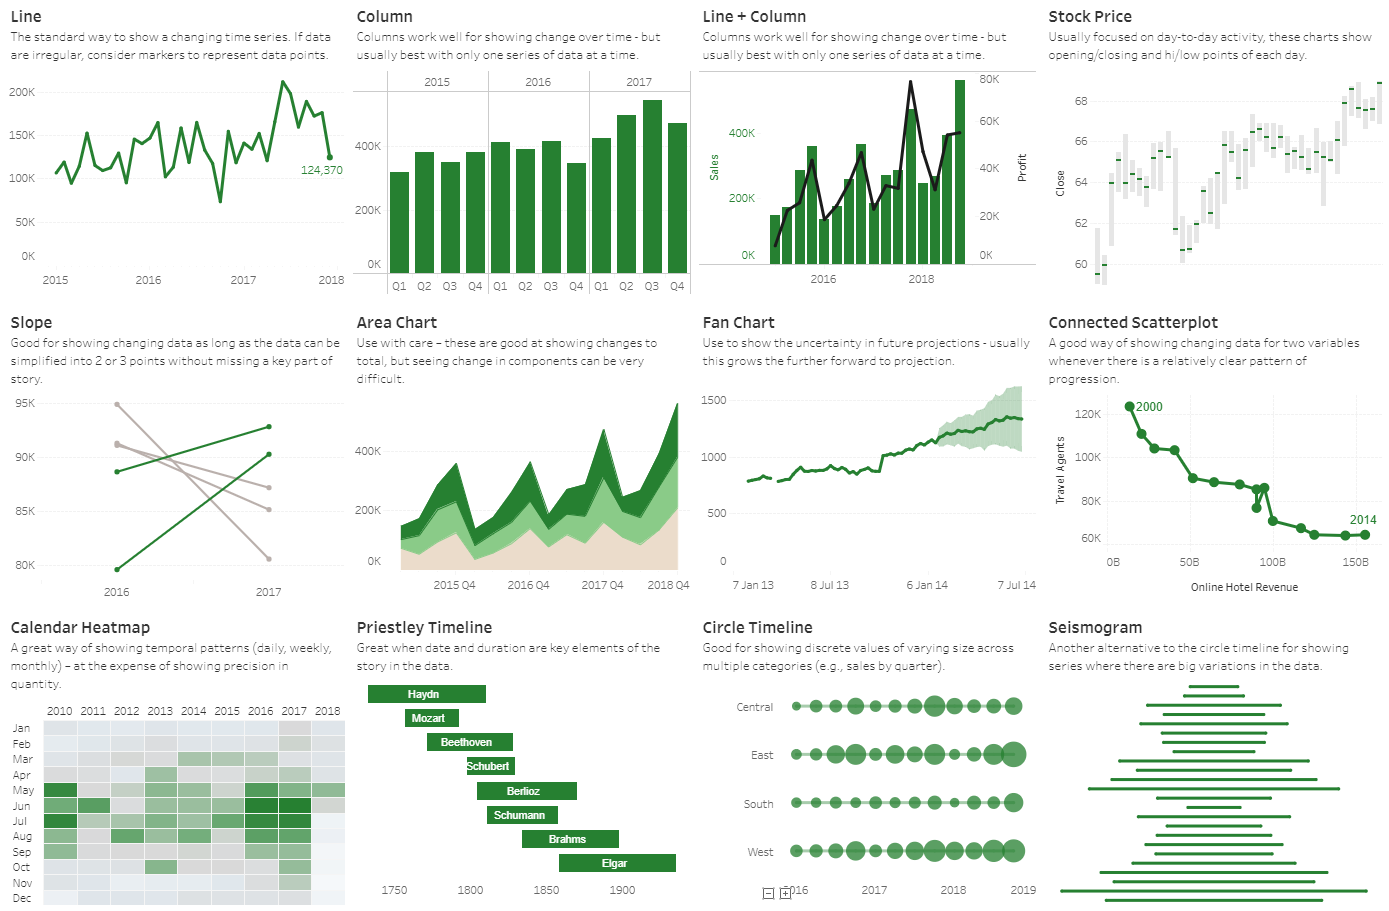
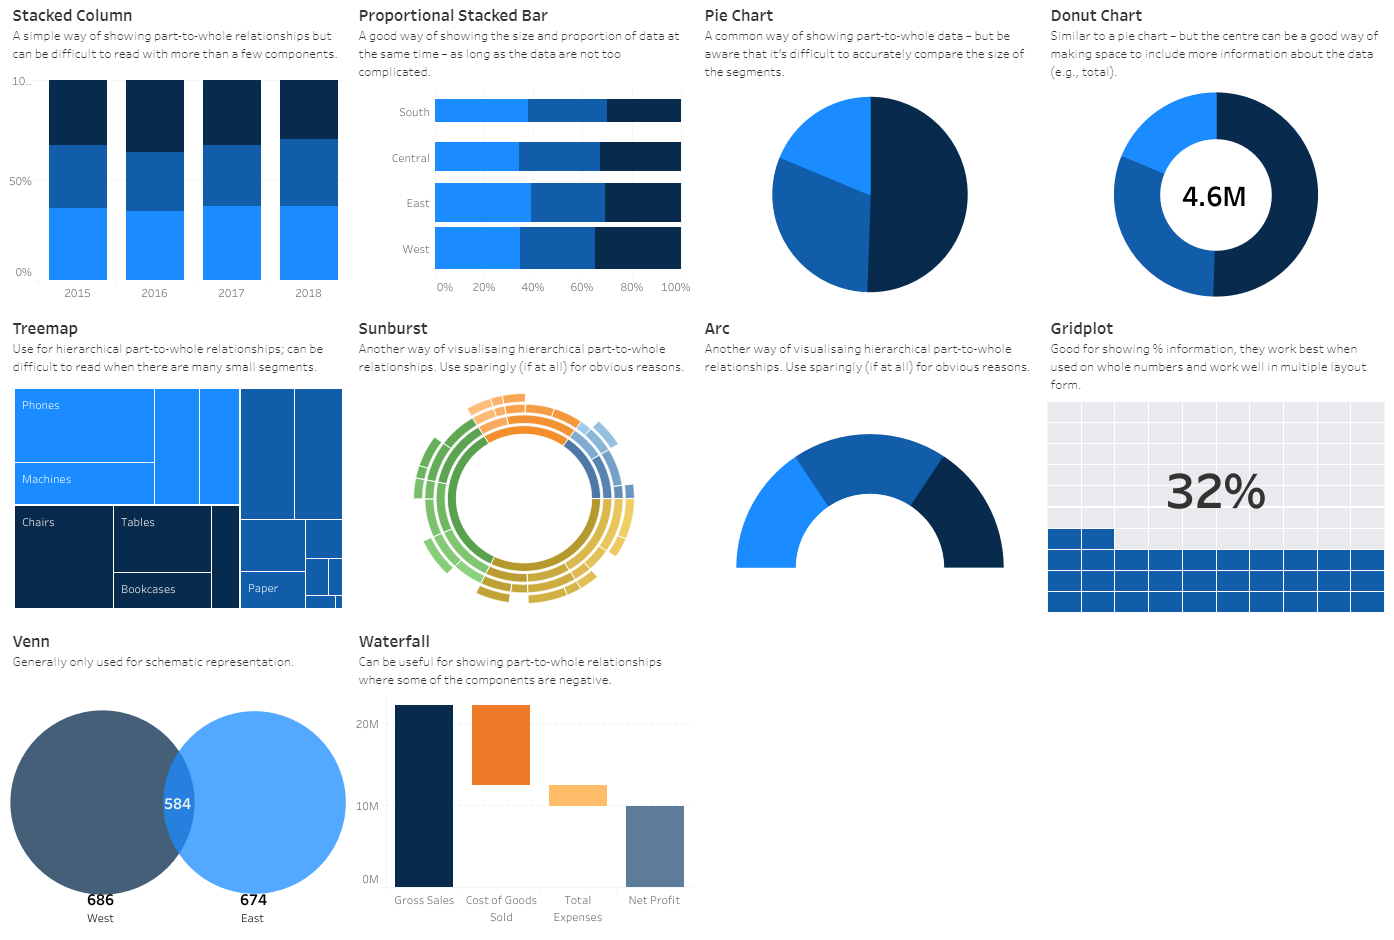
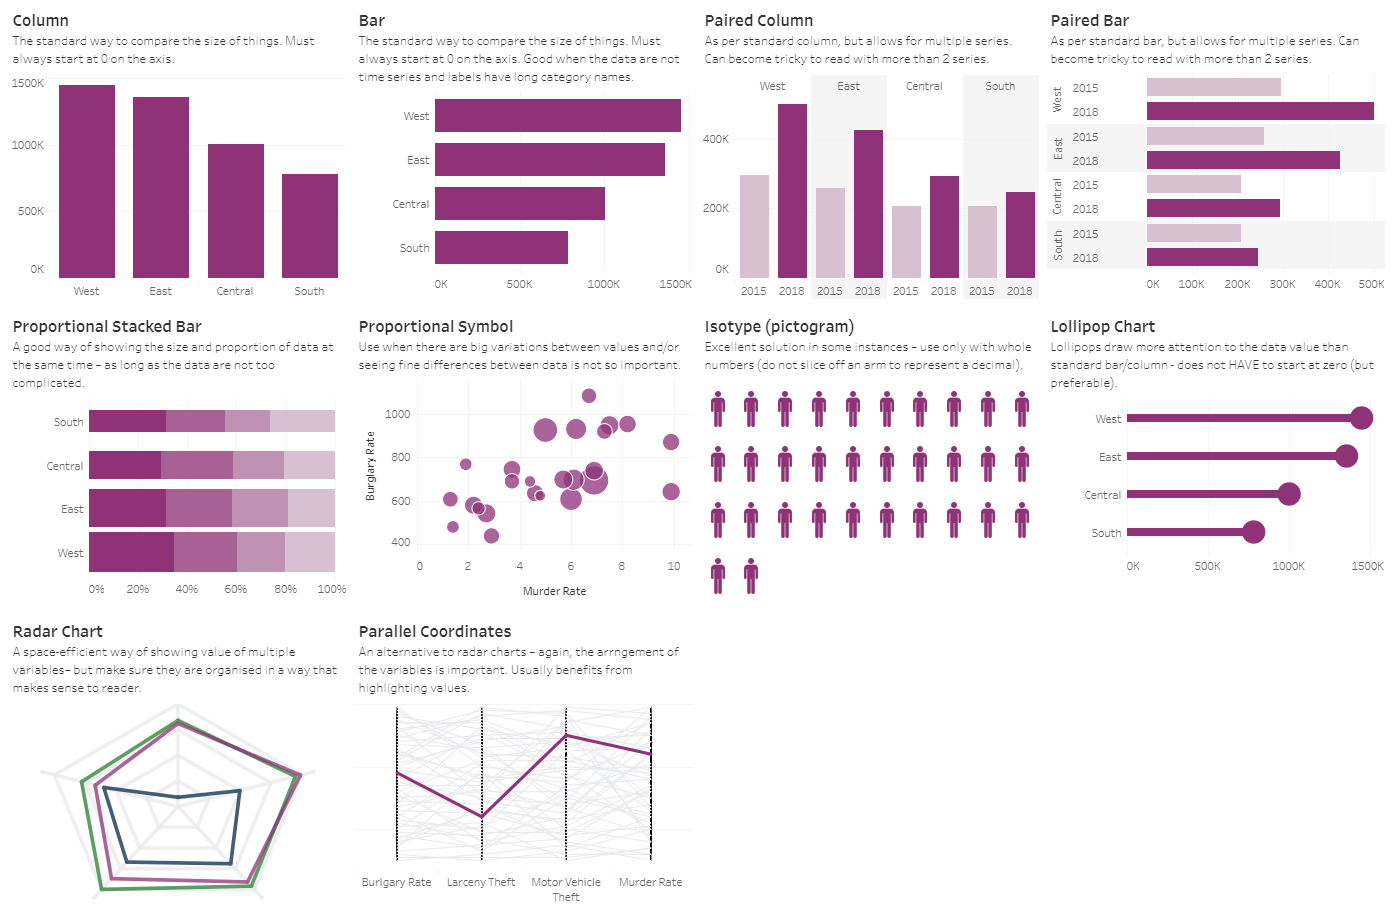
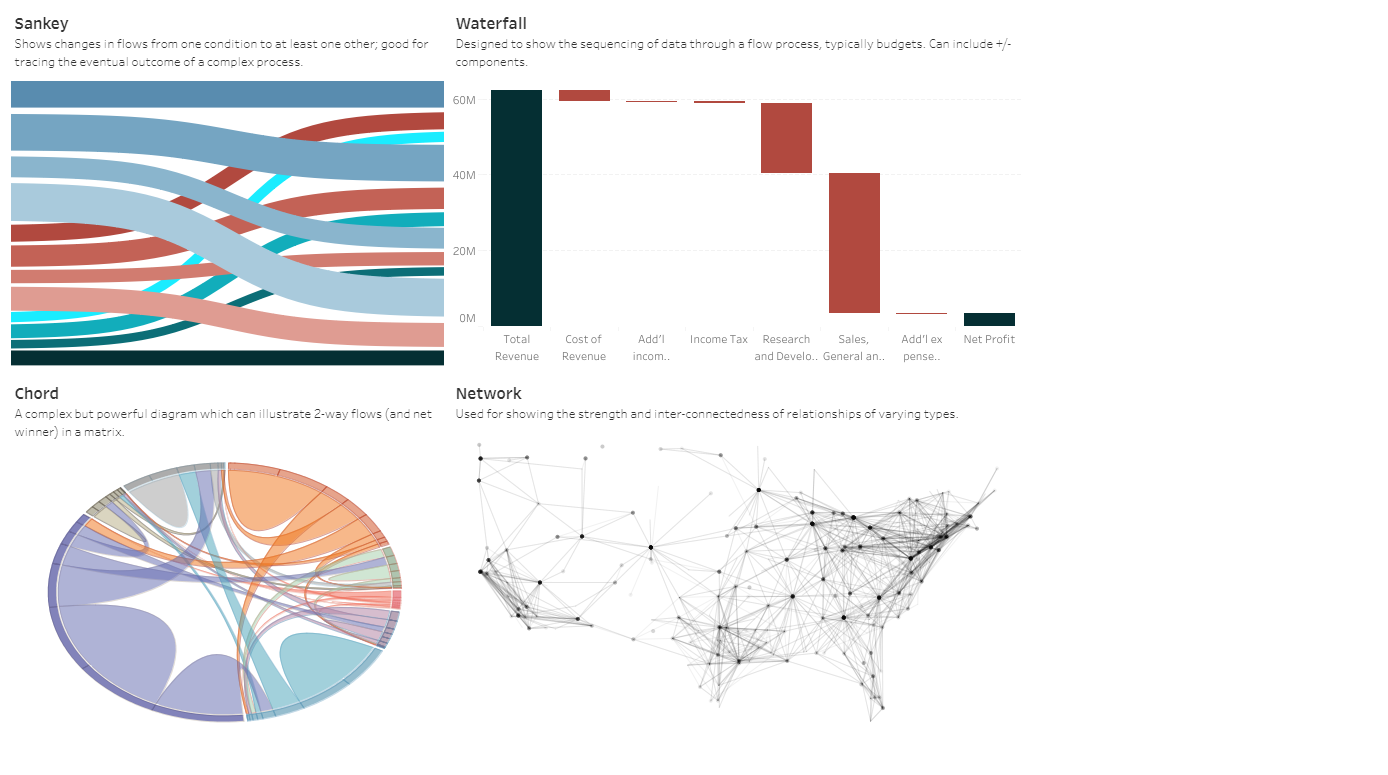
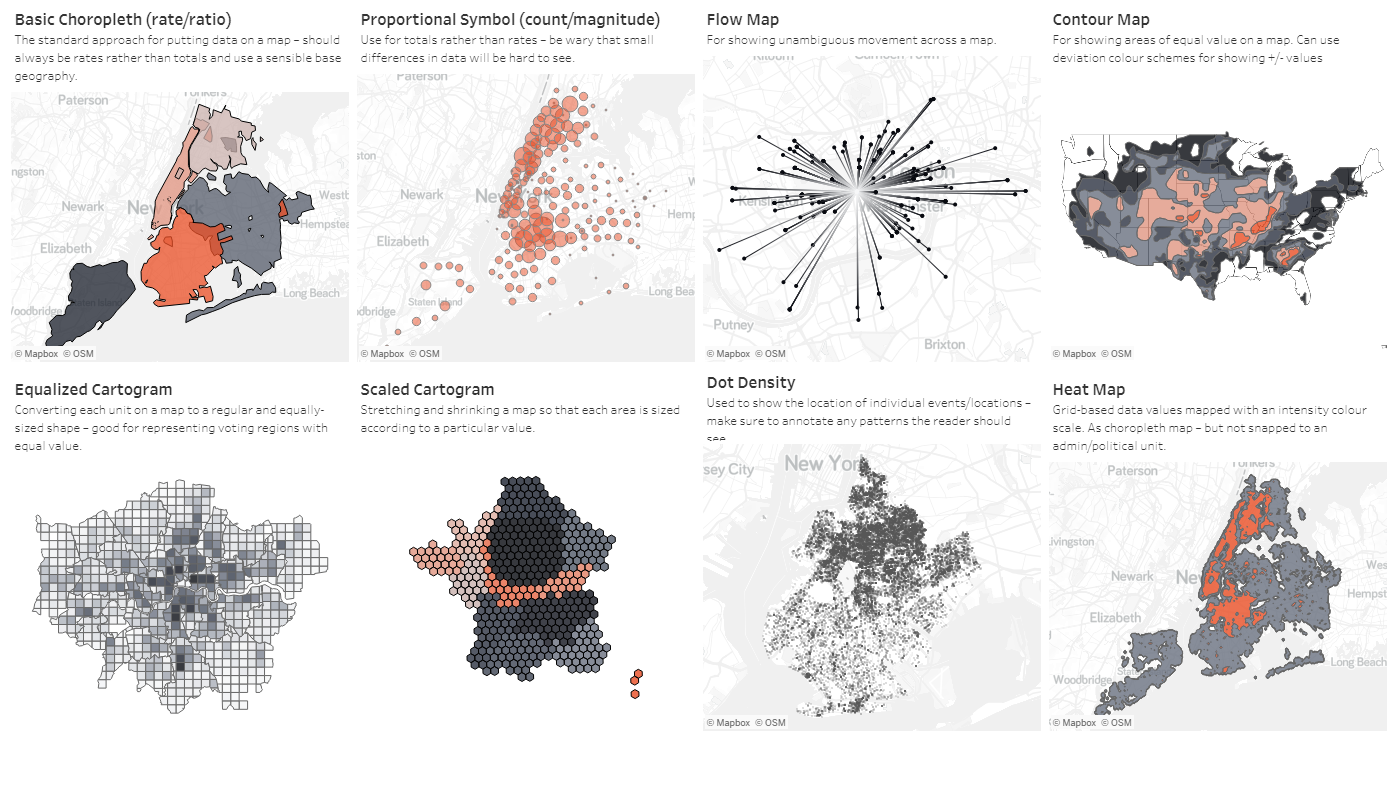
What you want a chart to communicate to an audience. While the allocation of each chart into specific functions isn't a perfect system, it still works as a useful guide for selecting charts based on your analysis or communication needs.
There are a plethora of different options when it comes to data visualization, and these common types are only the tip of the iceberg
Data Visuals With Tableau
What you want a chart to communicate to an audience. While the allocation of each chart into specific functions isn't a perfect system, it still works as a useful guide for selecting charts based on your analysis or communication needs. There are a plethora of different options when it comes to data visualization, and these common types are only the tip of the iceberg
After deep diving in DataViz & Tableau, we came up with our own process to go about the next Tableau Project by tweaking the old UX project process keeping Tableau capabilities in mind.
Tableau Project Process
- Understand & Analyzing Reports /
- Dashboards
- Break down of old structure
- New concept Mind Map/Flow
- UX concept Sketches
- Visual Design

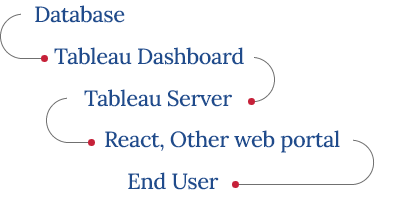
Tableau Solution Model
Our Tableau solution model, brings everything together in a visual environment that's accessible to anyone, yet supports advanced modeling and forecasting for Enterprise needs.
React & Tableau
Tableau UI is a React component library containing UI components for building web applications with the Tableau look-and-feel.
Getting a React application up and running with Tableau UI components, we achieved -

One way communication
In which you just call the report from server in iframe and all interaction managed from tableau server.

Two way communication
In which you can also send some filter to the server and as per filter the report will change.
Highlighted in the high level diagram of the solution model Interface comprising of tools such as Tableau & inhouse developed Extension which helped to enhance the filtering & table formatting smoothly and without any limitation
Additionally
- To publish reports and share with the business users via their in-house web portal.
- To restrict end users to access data as per their role.
- To schedule a subscription to receive report screenshots in the mail.
- To automate reports refresh process for multiple dashboards (from various data sources).
- To enable ease of creating the reports. Reducing the turnaround time for BI Projects.
Tableau Projects
Aim
Create an interactive report, utilizing Tableau, to convey the data that had been collected & represented by using other BI tools or by Excel
Tools
Tableau, Adobe XD, Illustrator & Photoshop
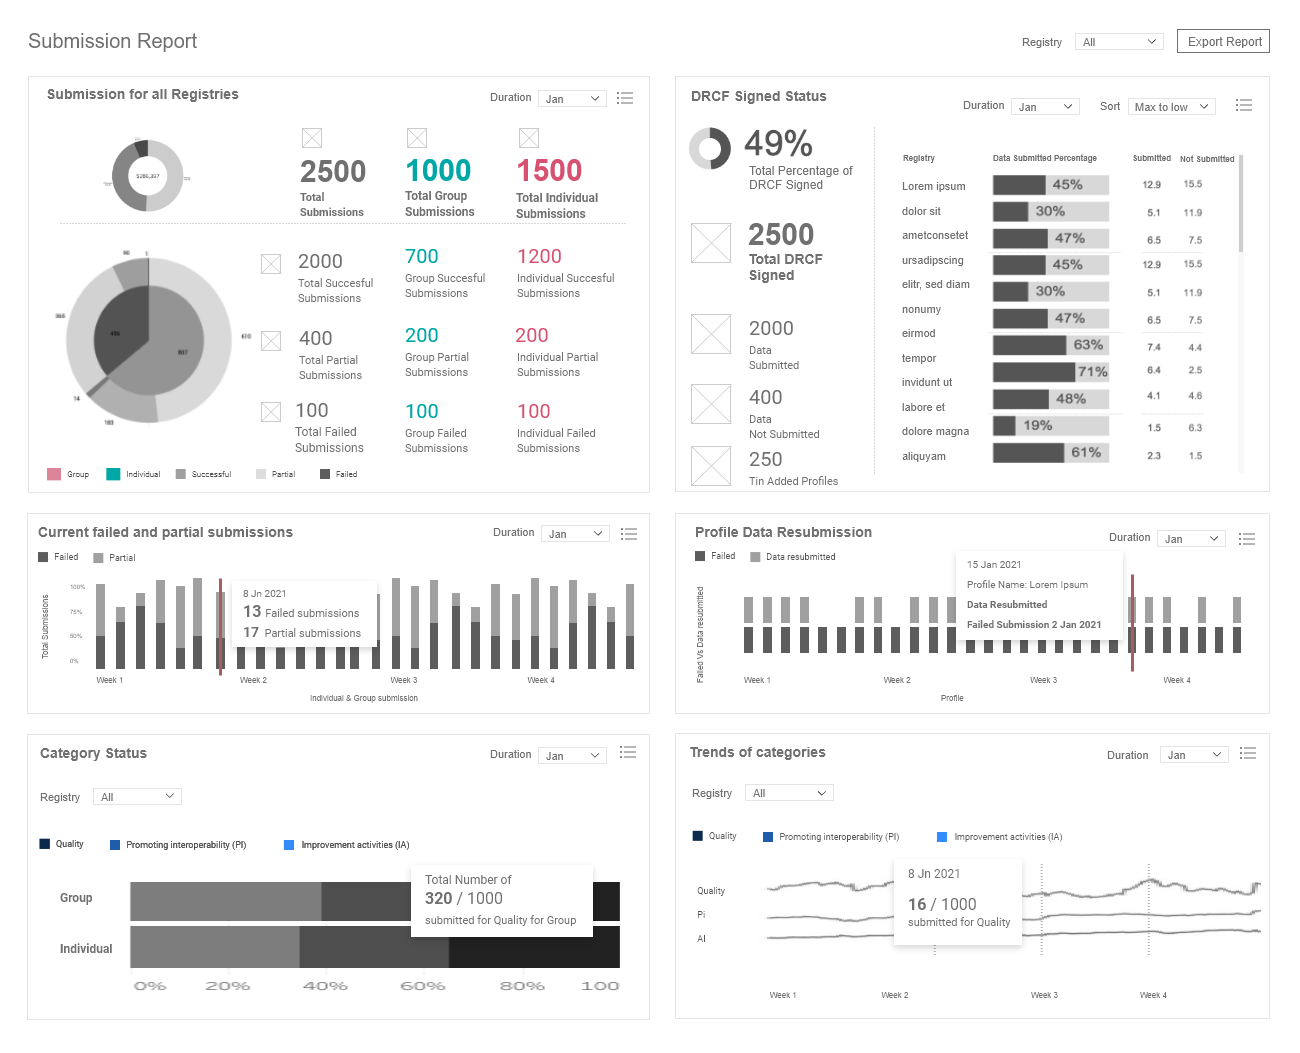
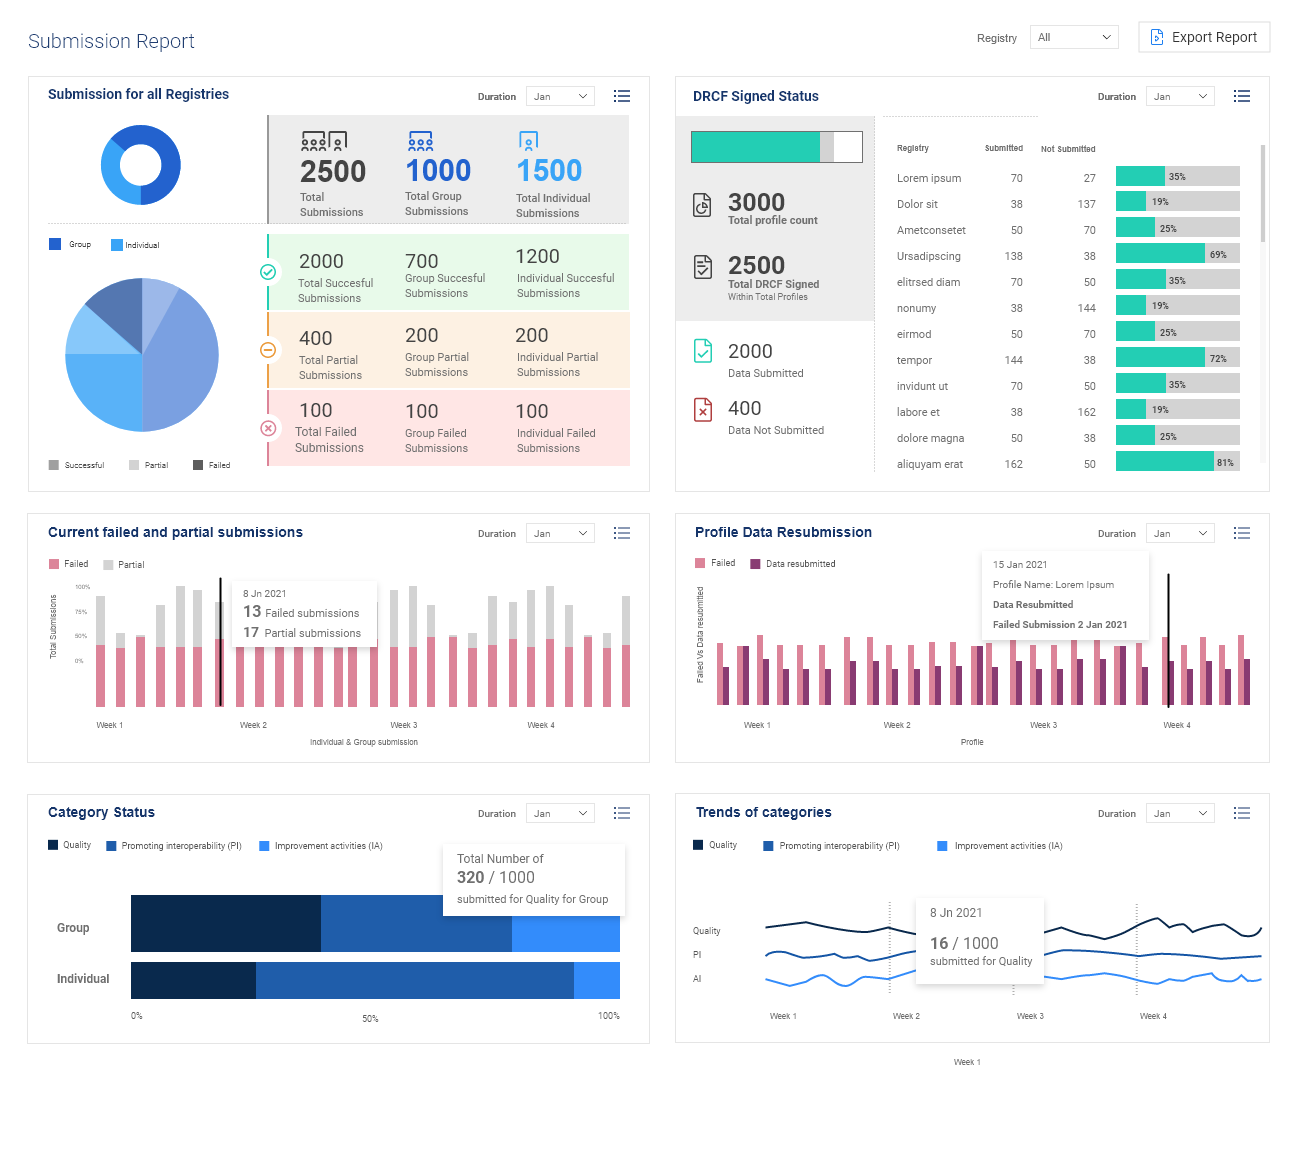
Submission Report

Dashboard helps executive decisions along with overview, that includes Total & registry level submission status & DRCF data submission Status Key requirements UX Process Research, Low Fidelity Wireframes, Visual design, Frontend integration Tableau
Key Requirements
- Executive report of submissions for all registries (Successful, Partial, Failed) at Individual/Group level.
- DRCF signed Vs Data submitted - As per my understanding, Not signed DRCFs are not part of this report, please confirm.
- Trends of submission at the registry level during the reporting period.
- a. Trends of individual vs group submission in registry on a daily basis
- b. Trends of categories submitted in the registry on a daily basis.
- c. Trends of DRCF signed and data submitted on a daily basis At Registry level only right?
UX Process followed
Research, Low Fidelity Wireframes, Visual design, Frontend integration Tableau
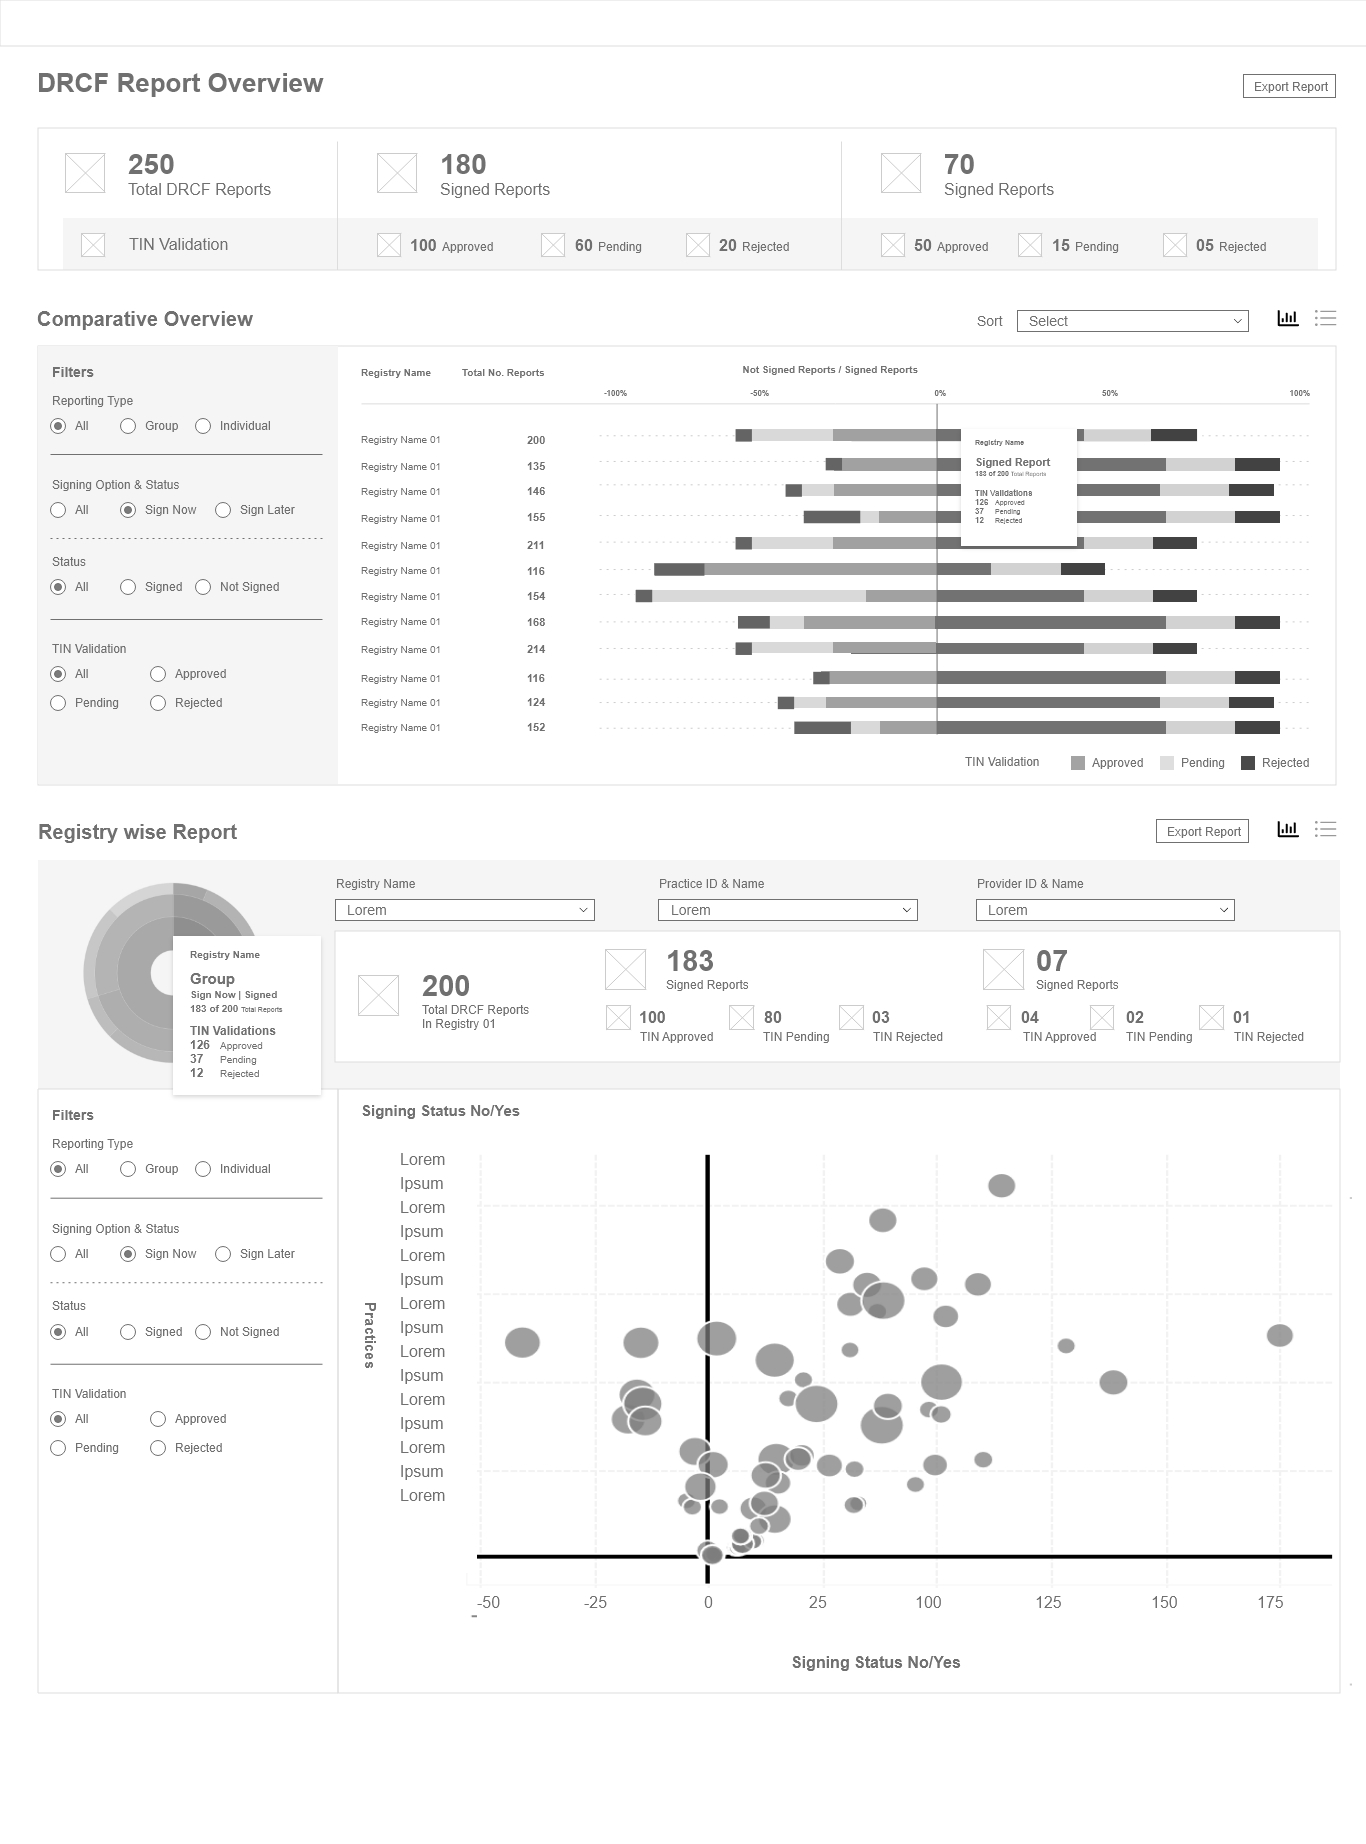
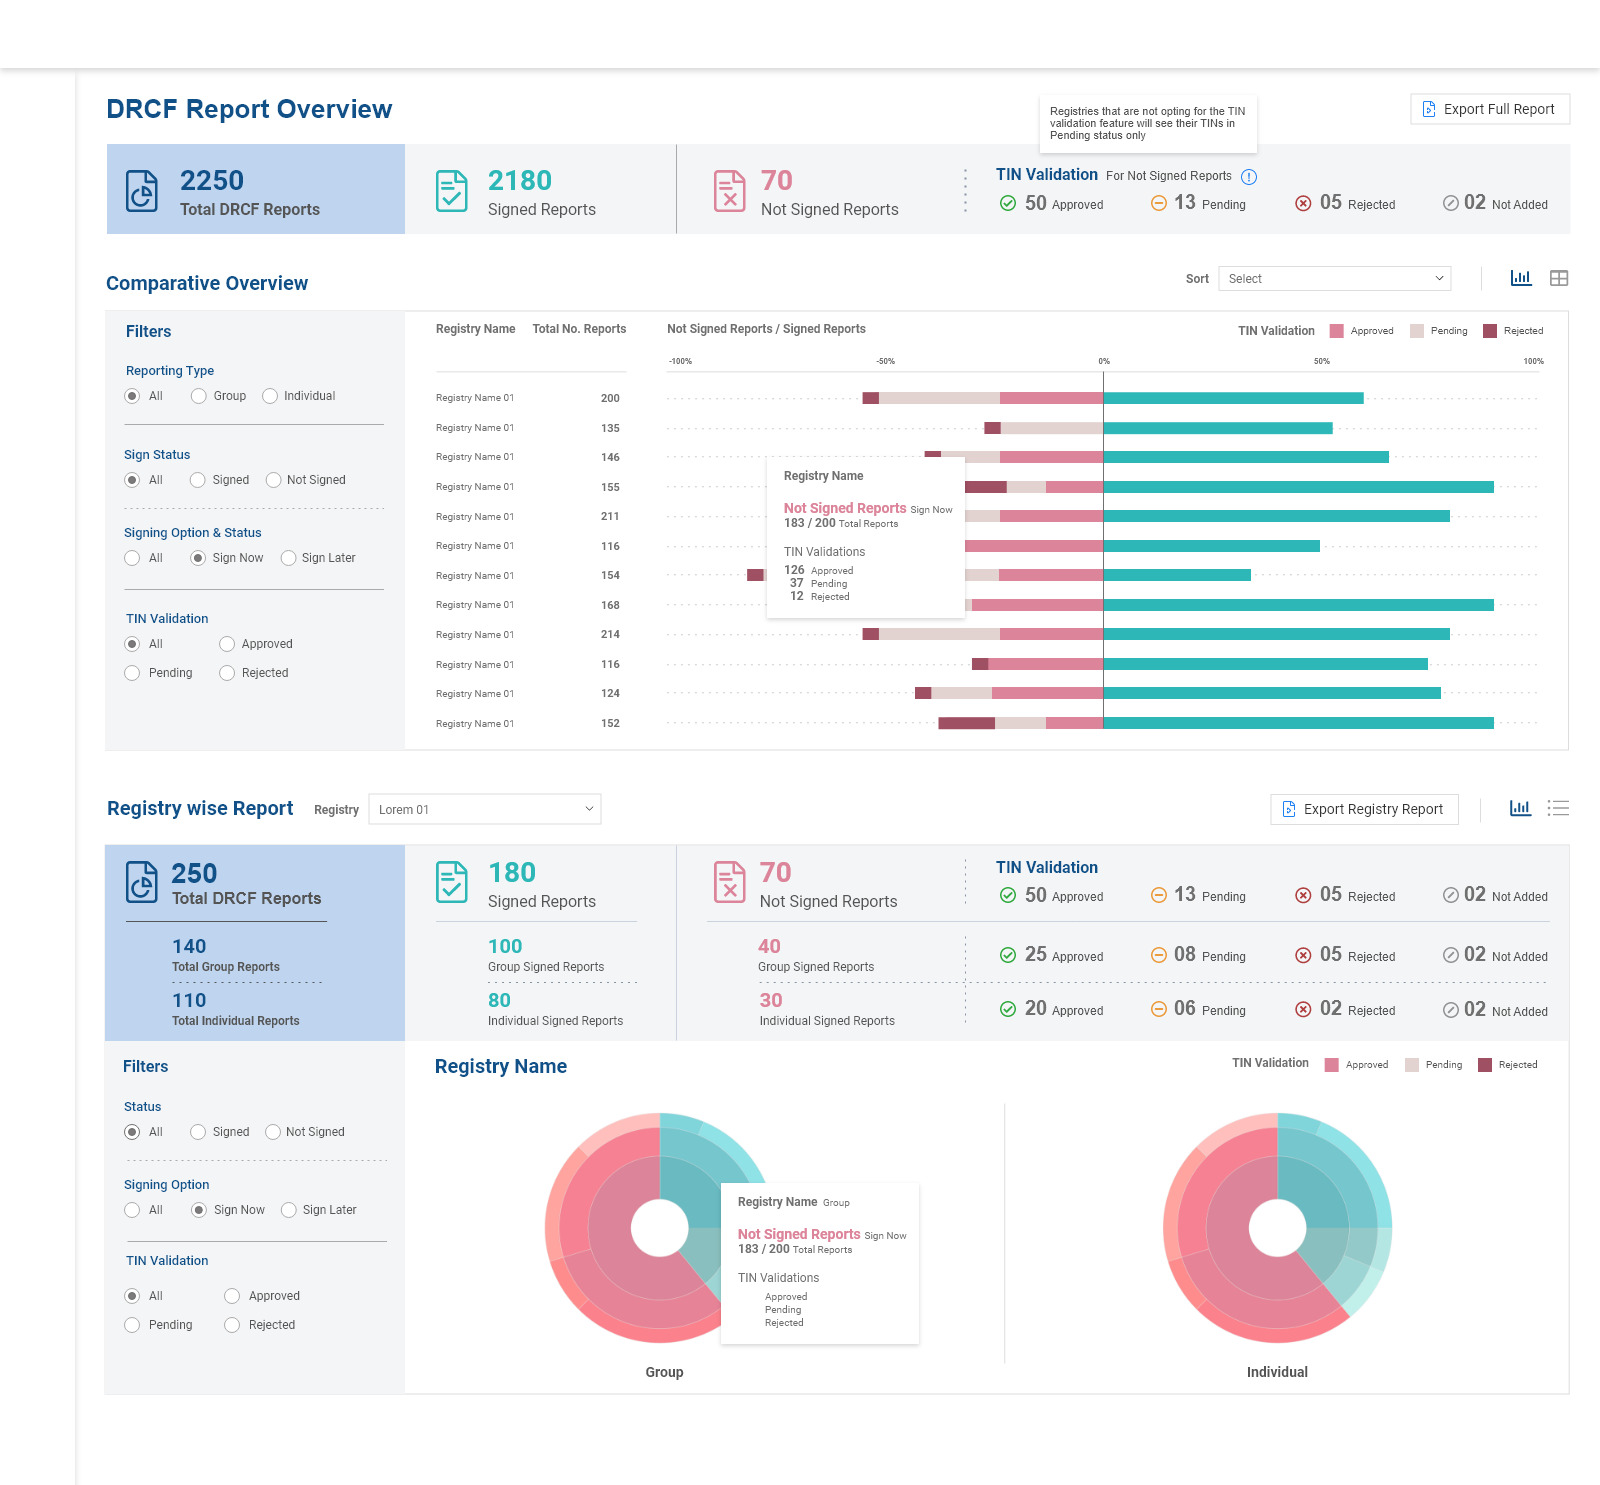
DRCF
the American College of Radiology is at the forefront of radiology evolution, representing nearly 40,000 radiologists, radiation oncologists, nuclear medicine physicians and medical physicists Achievements
Achivements
- Combined two reports in the form of only spreadsheet which help for the MIPS submission.
- Helps Internal teams to analyze DRCF status for ACR & present clean overview of Signing & TIN validation statuses to take prioritised actions on them.
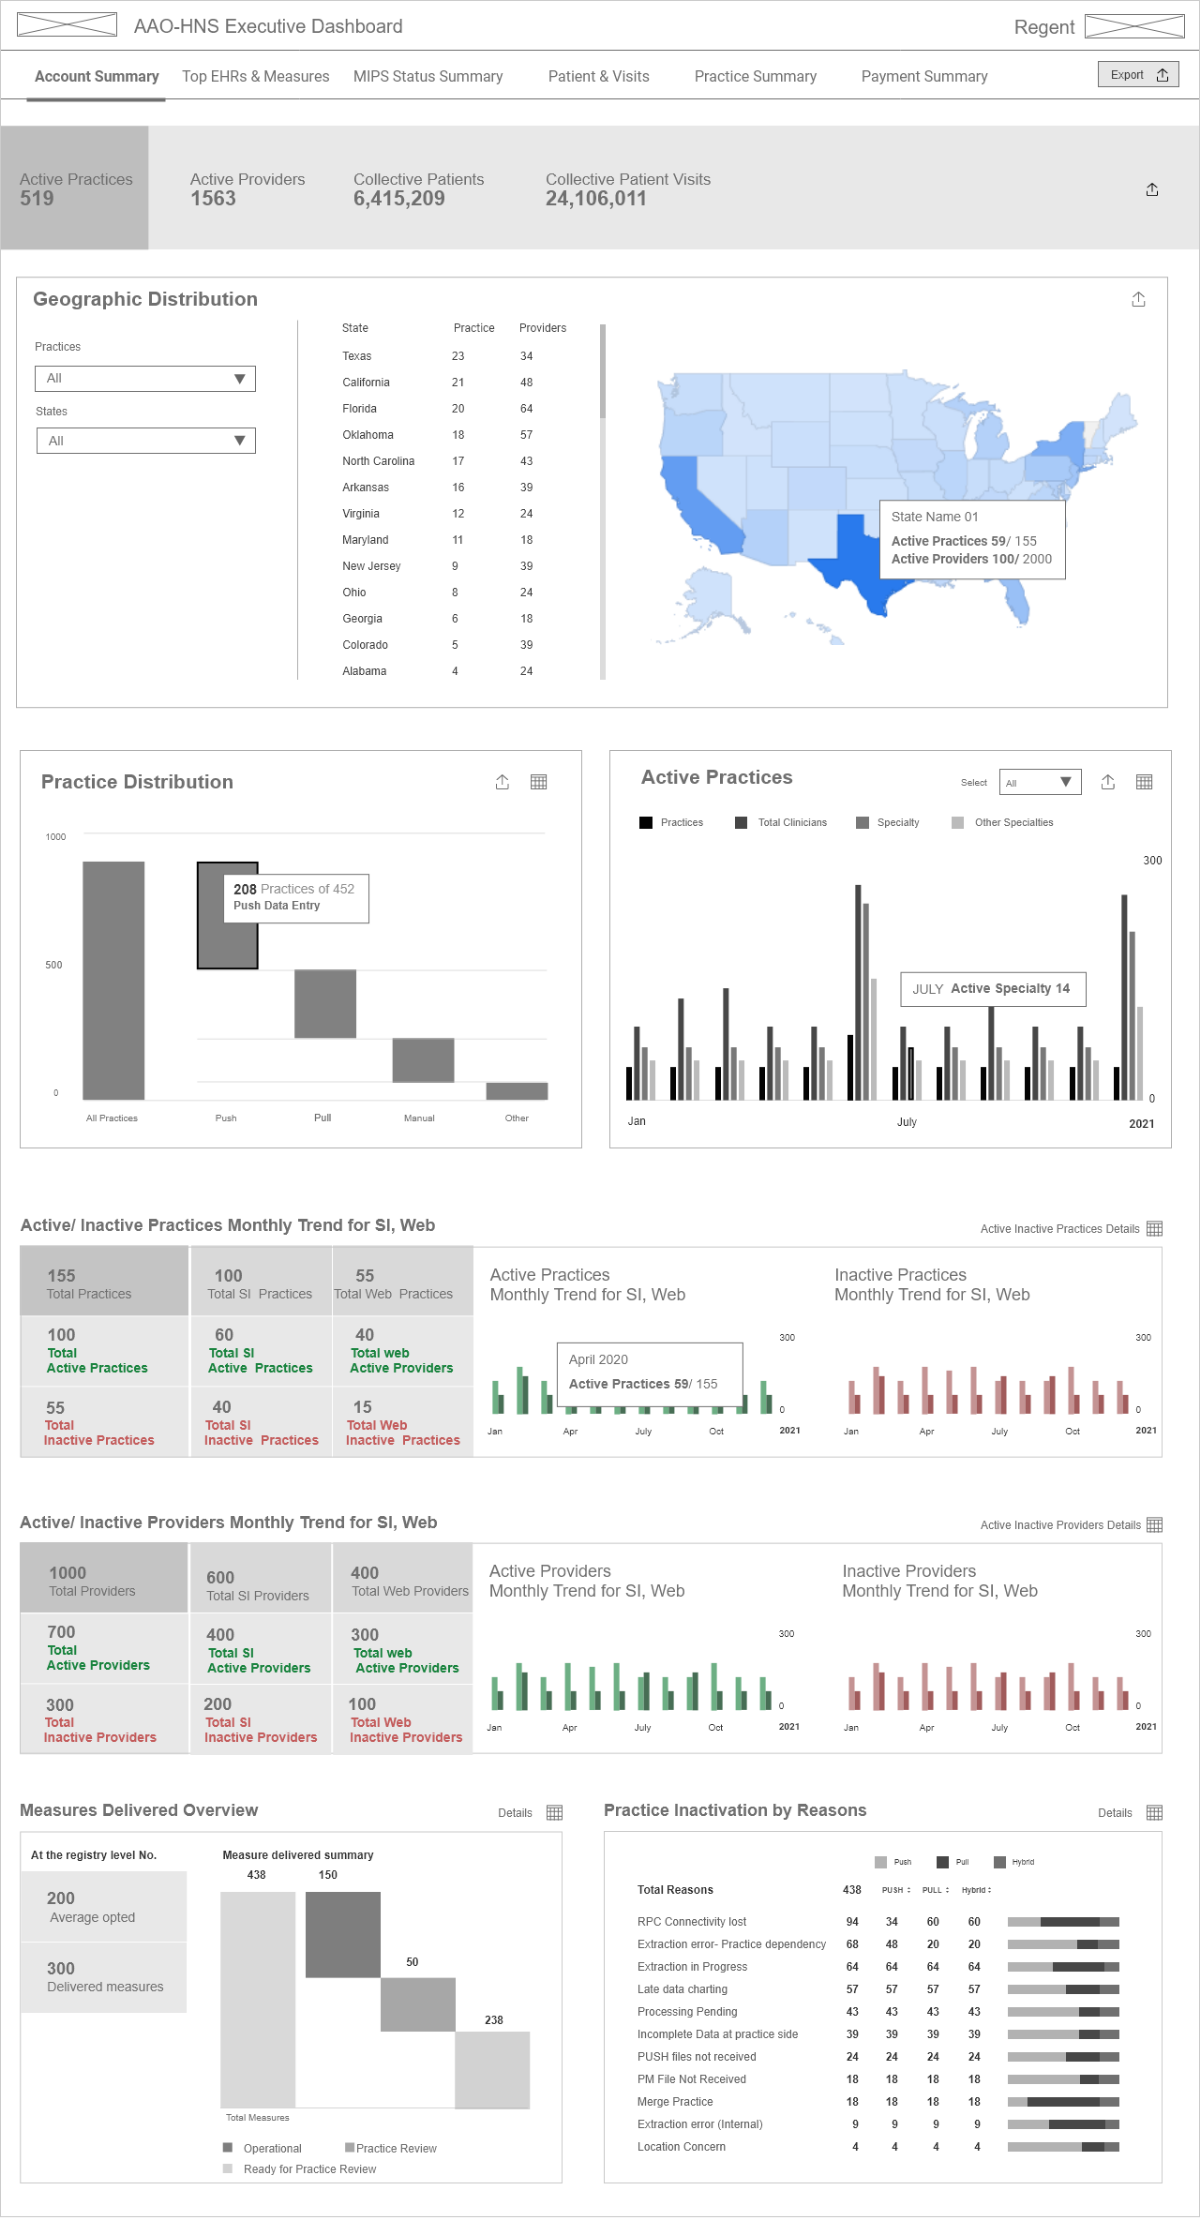
AAO-HNS Executive Report
The American Academy of Otolaryngology–Head and Neck Surgery AAO-HNS is one of the world’s largest organizations representing specialists who treat the ears, nose, throat, and related structures of the head and neck. The Academy has approximately 13,000 members.
Achieved
Summery of Registry in the form of the Dashobard - Active/Inactive Count of Practices, Clinicians, Key Speciality & other Speciality, Monthly Trend for same, Inactivation Reasons & Measure Delivery Overview
Along with other tabs for EHR, MIPS, Patient Visit, Payment Summaries
HNS Practice Search Report
The report can give registry user information about any practice
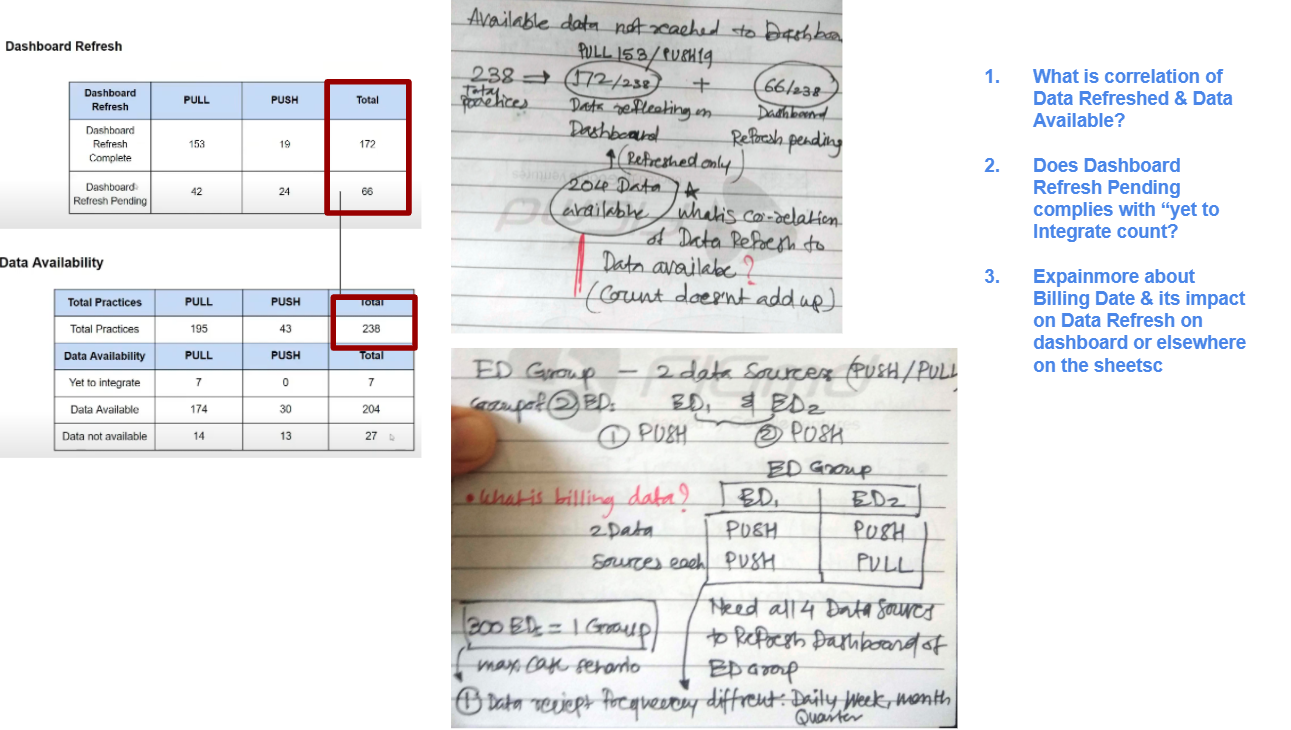
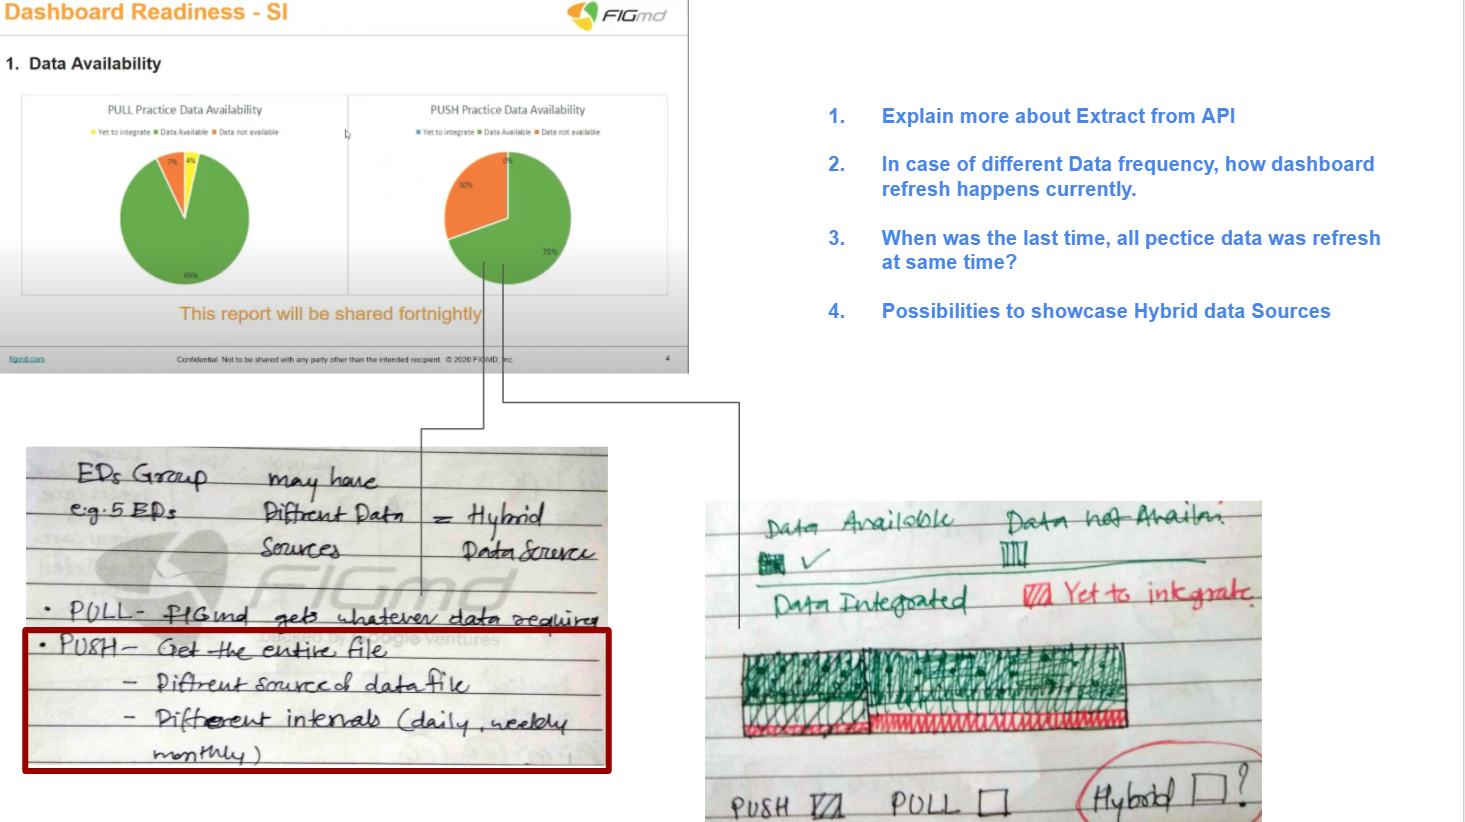
ACEP CEDR Report
CEDR (Clinical Emergency Data Registry) is the first Emergency Medicine (EM) specialty-wide registry
developed by ACEP.
CEDR has the capability and functionality to do the following:
- Measure EM outcomes
- Identify practice patterns and trends
- Improve the quality of acute care
- Meet and exceed QPP/MIPs quality reporting requirements
- Eliminate penalty and/or increase payer revenue
In addition, the CEDR registry ensures that emergency physicians, rather than other parties, are identifying practices that work best for them.
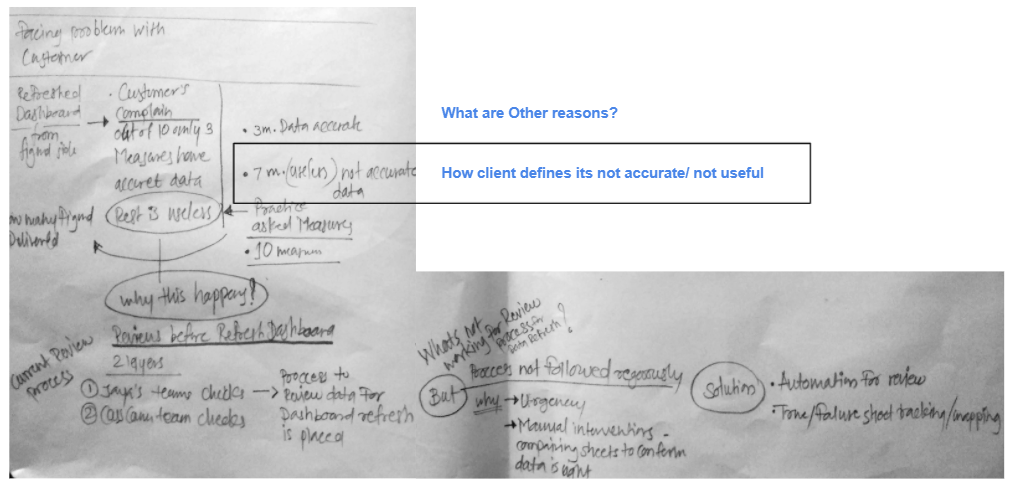
Brainstorming after Focus Group Discussion
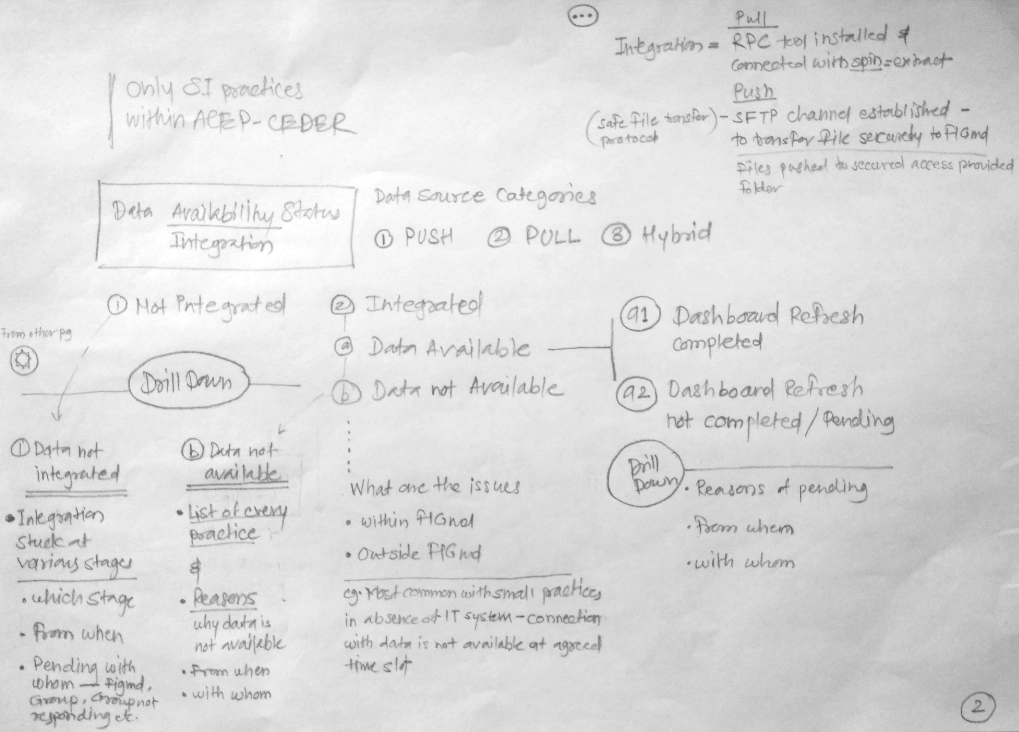
Early breakdown of DataViz Concept
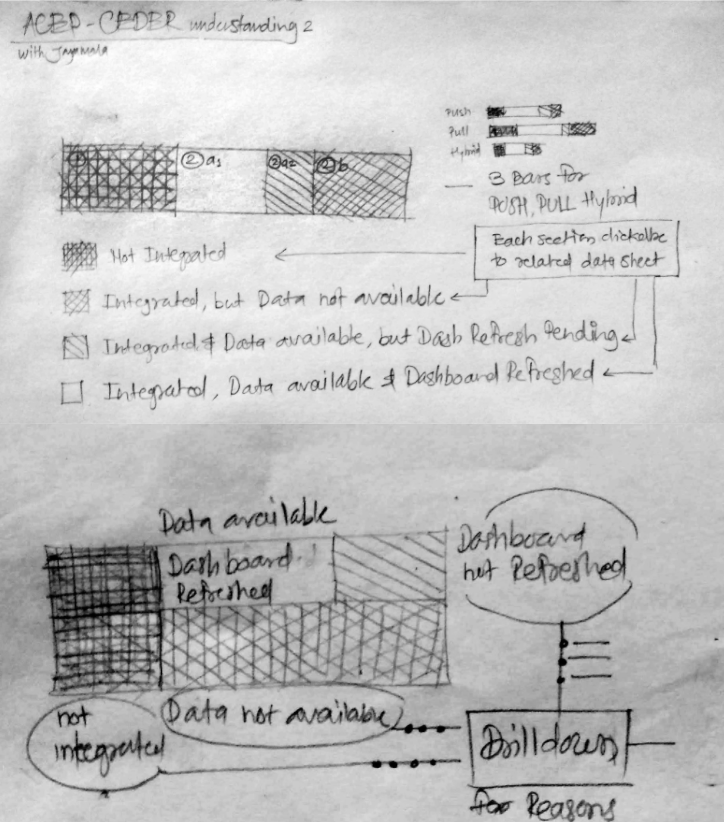
Reconnect with Stakeholders with understanding clearance
DataViz Concepts for key areas & reassurance of data understanding with Stakeholders
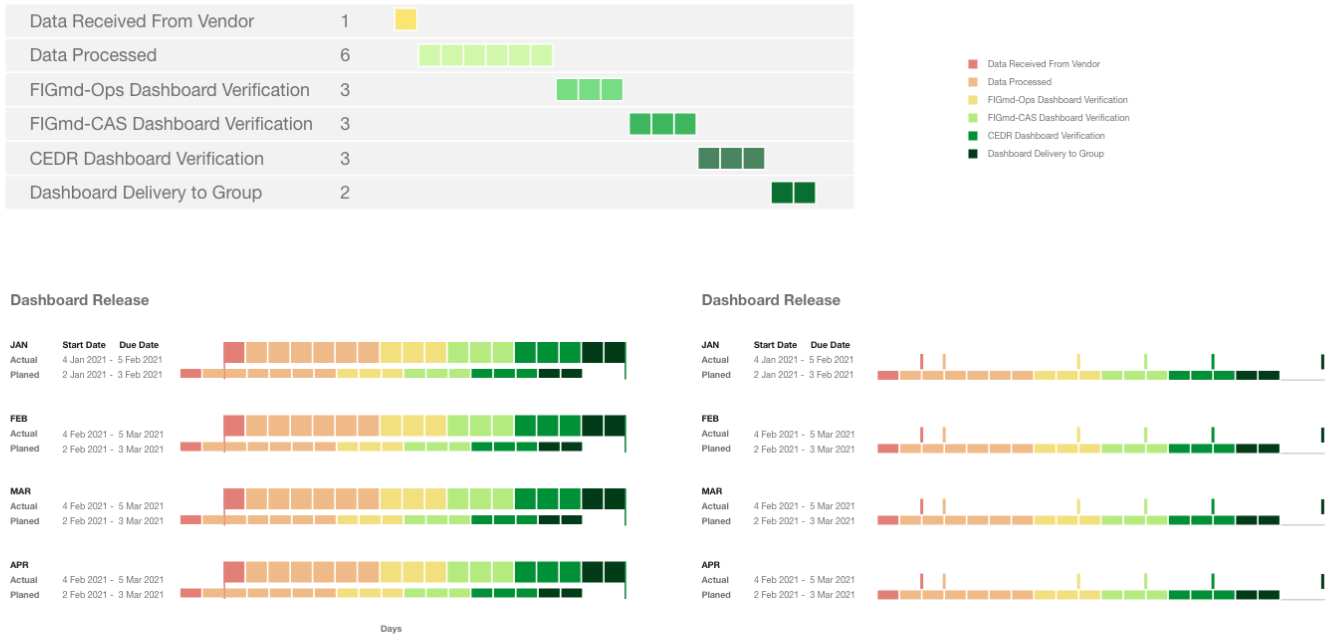
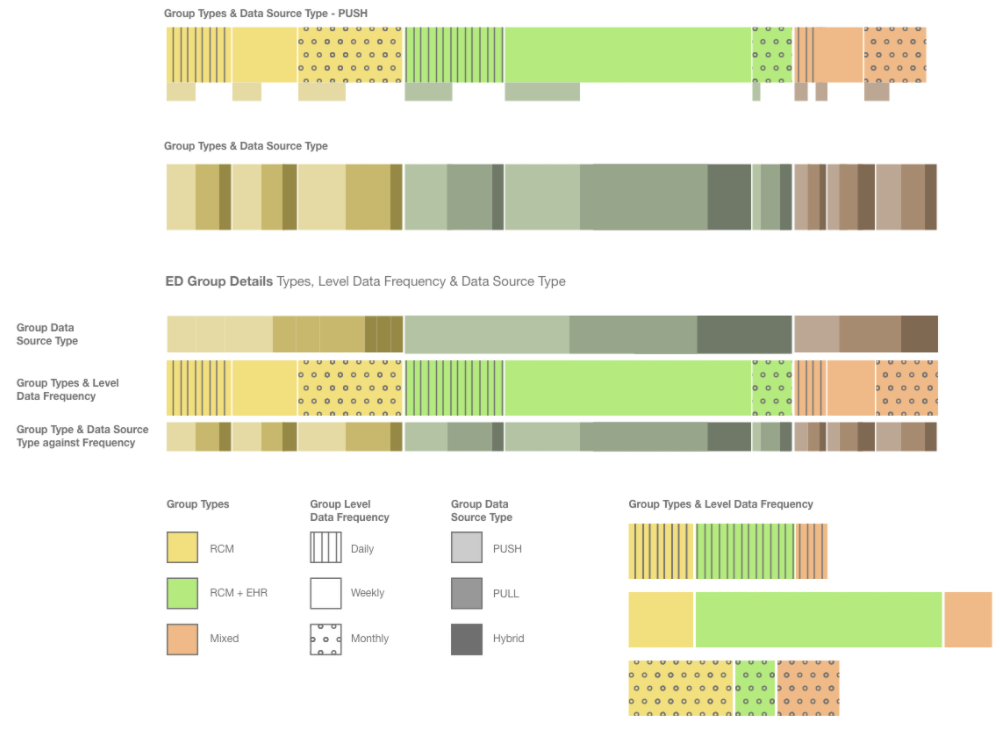
Report concept with complete solution
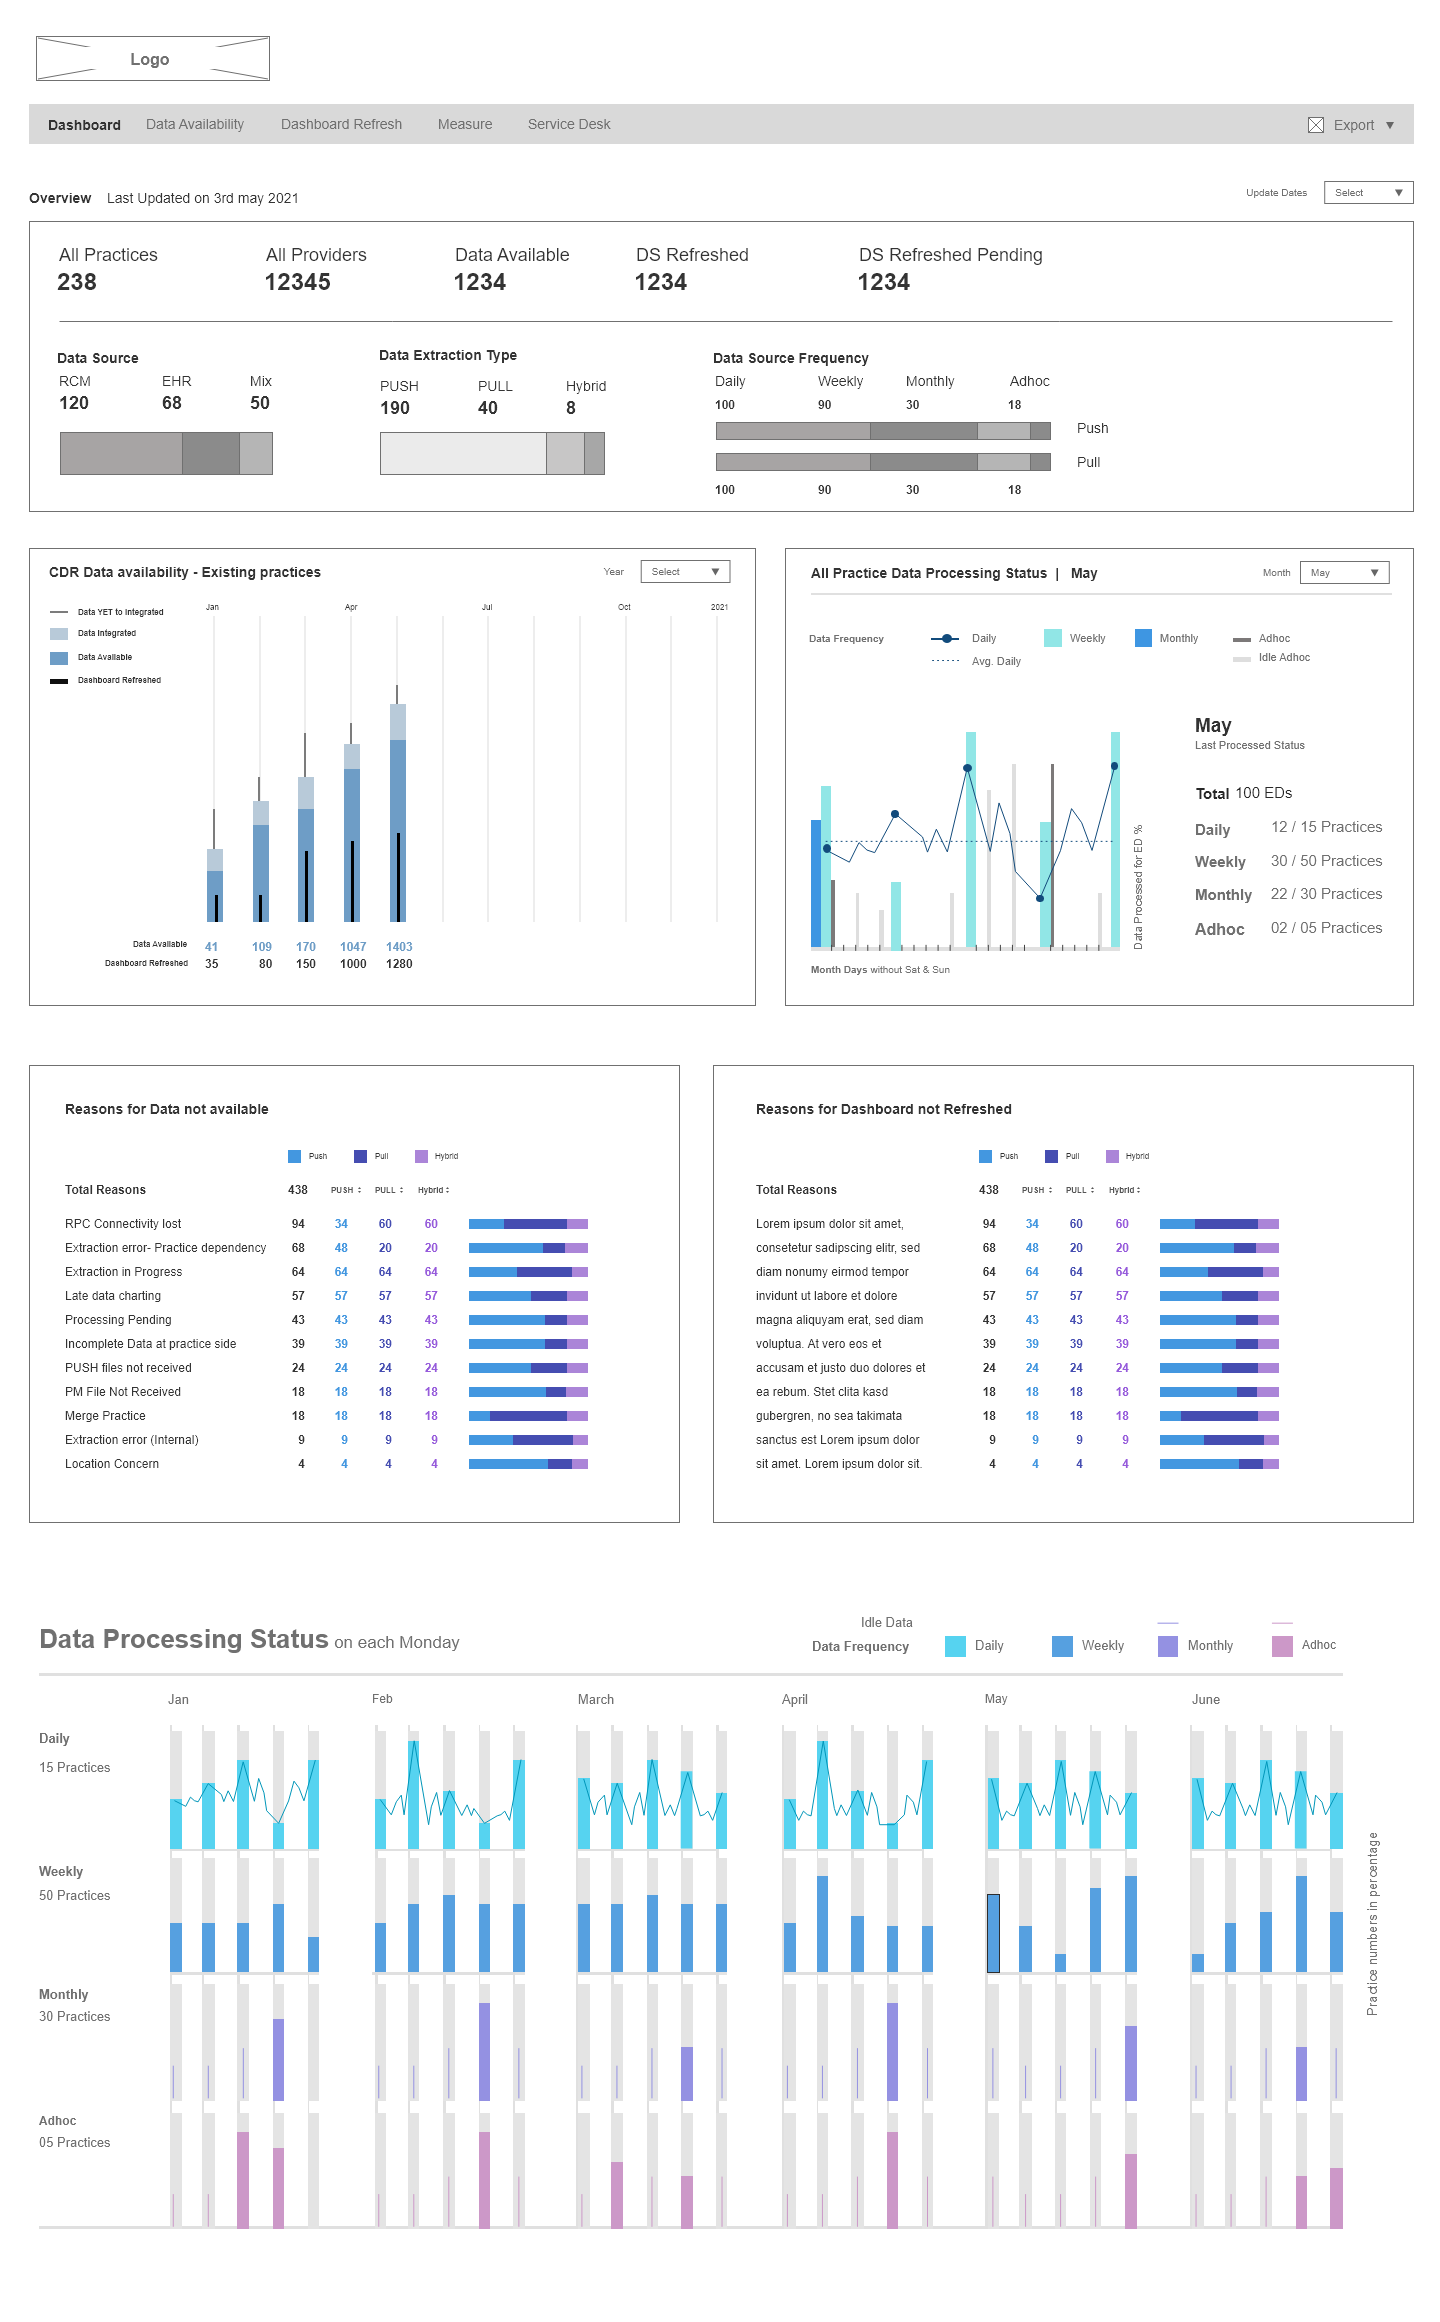
Development, Extensions & possibilities
Developed tableau extensions: We develop a tableau extension for table view which can provide following benefits tableau:
Type search filter:
We develop a grid tableau extension in which you can filter your data as you type in search filter
Change header column name:
Using this config you can change the column name.
Add link on dynamic data:
We achieved to add a link on every individual column of the table not for all tables.
Column level filter:
You can also filter at column level and it could be visible or not as per our need.
Column color:
We also provide column color config in which you can directly provide column color.
Number of record:
It also provides a number of records on the screen.
Free Extensions
Tableau provided many free extensions which can directly use in our report
Here some reference:
https://extensiongallery.tableau.com/extensions?version=2021.1
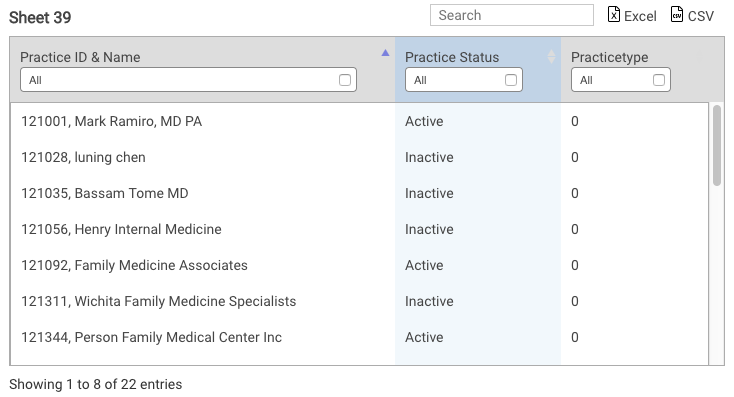
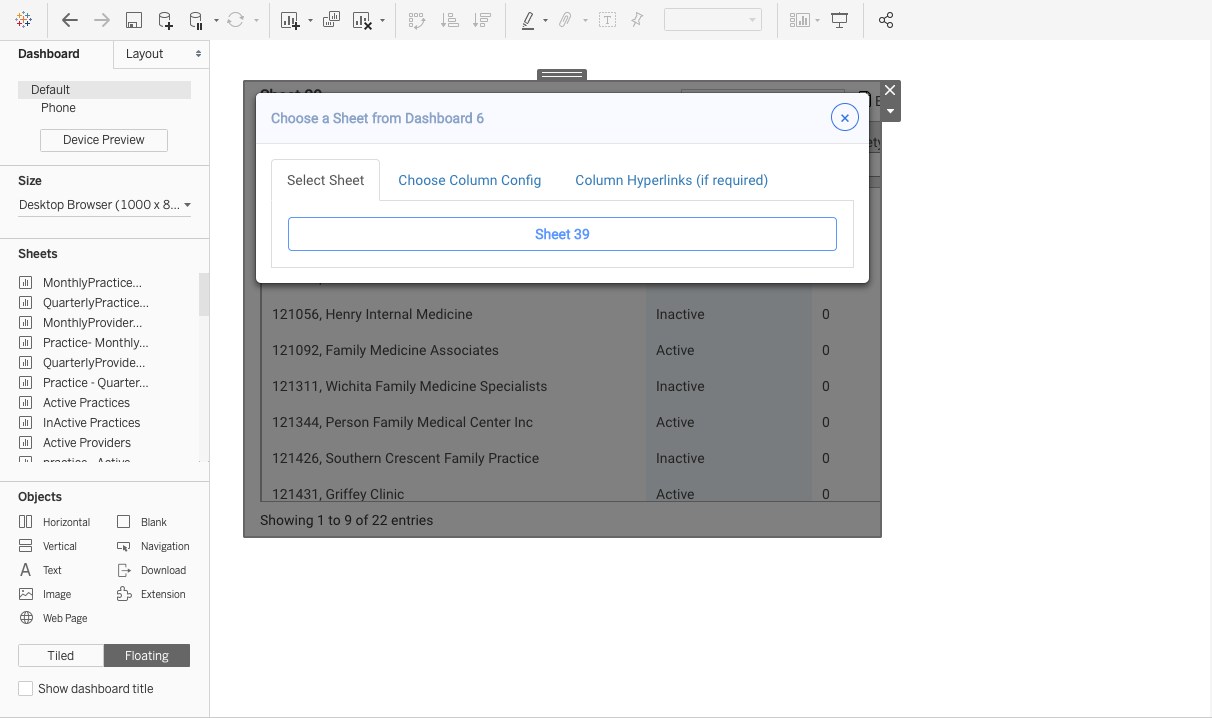
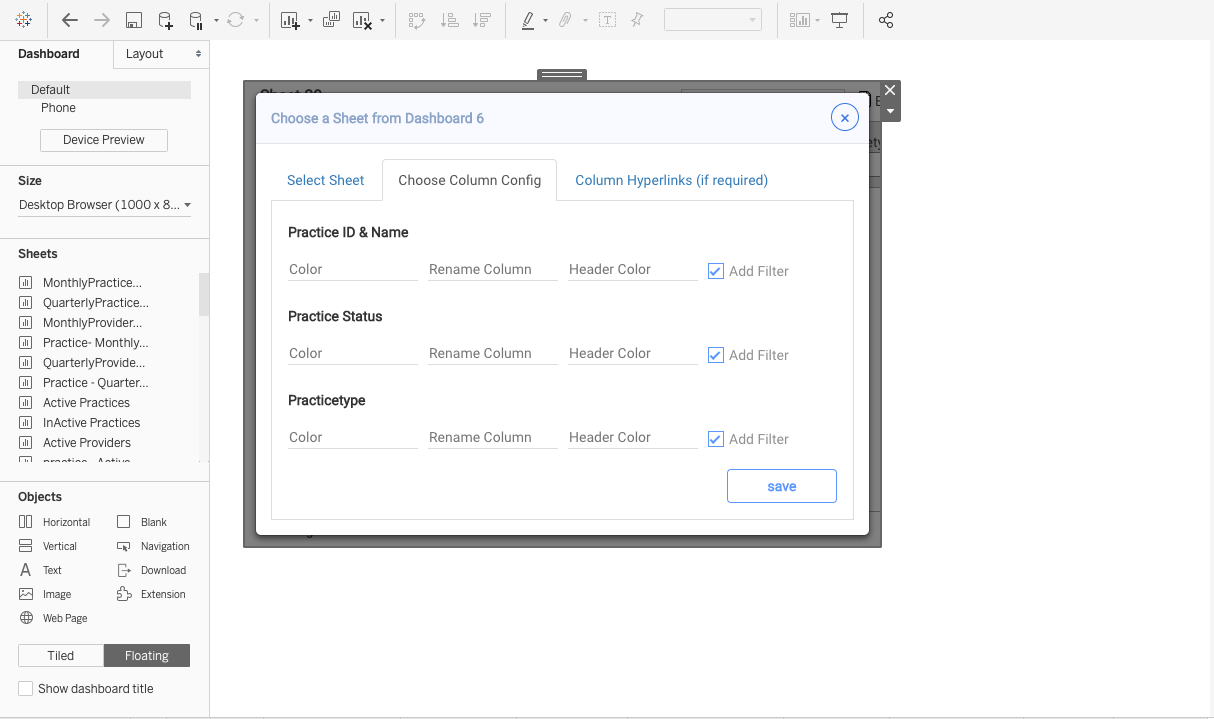
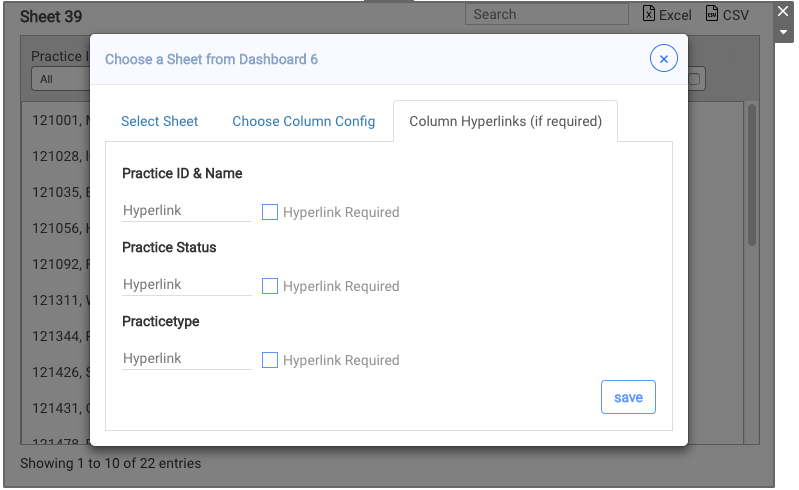
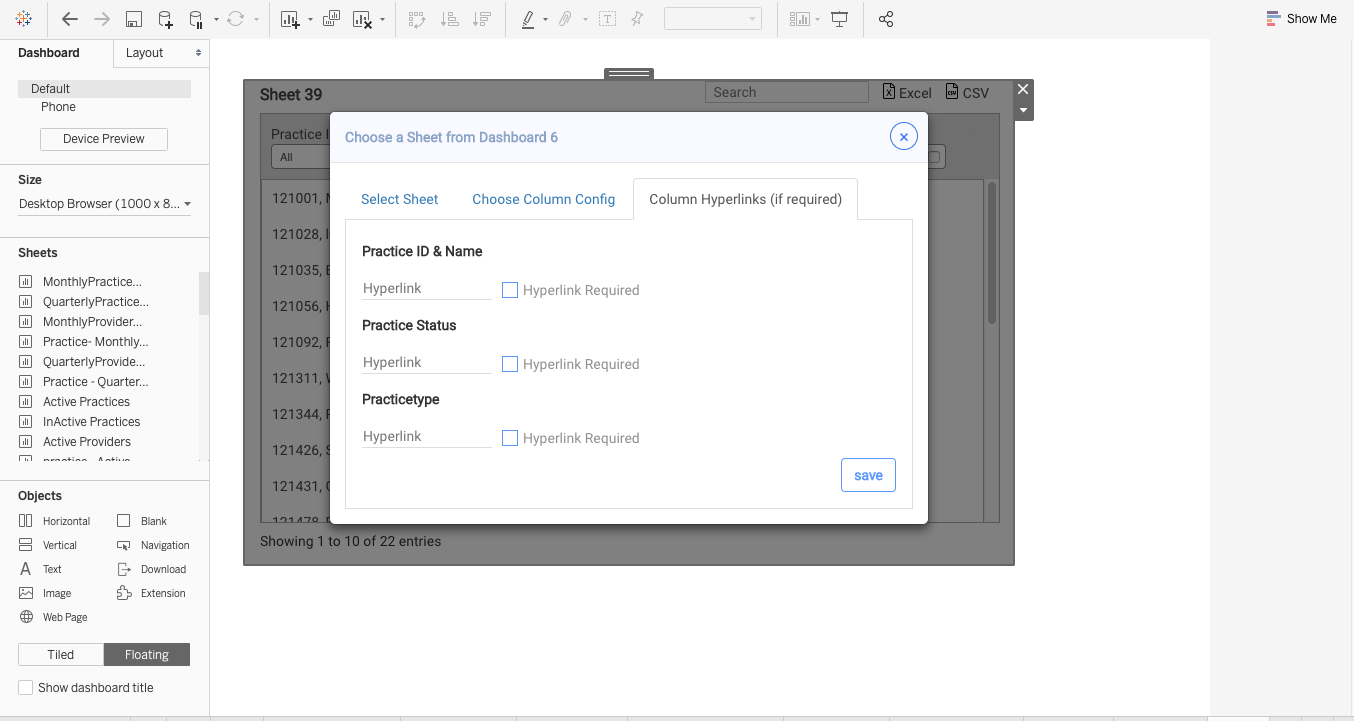
Tableau Limitations
Single developer at a time and hard to version control:
Because a single developer can work at time it takes time to develop and also very difficult to version
control if a file will override with a new file there is no way to get an older version.
Tableau uses a SQL database:
Because Tableau uses a SQL database, users are restricted to specific, predetermined paths within a narrow portion of data. That means the platform only analyzes part of your data, leaving out key patterns and connections.
AI-Powered Recommendations:
Because Tableau’s Ask Data feature is not core to the platform, it only connects to data sources, which means it can’t leverage the insight your analysts have built. Specifically, it doesn’t work with the business logic built into workbooks because it can’t access workbooks.
Less UI tools:
Tableau provides a very limited tool to design desktop dashboards.
Collaborative Future with Tableau
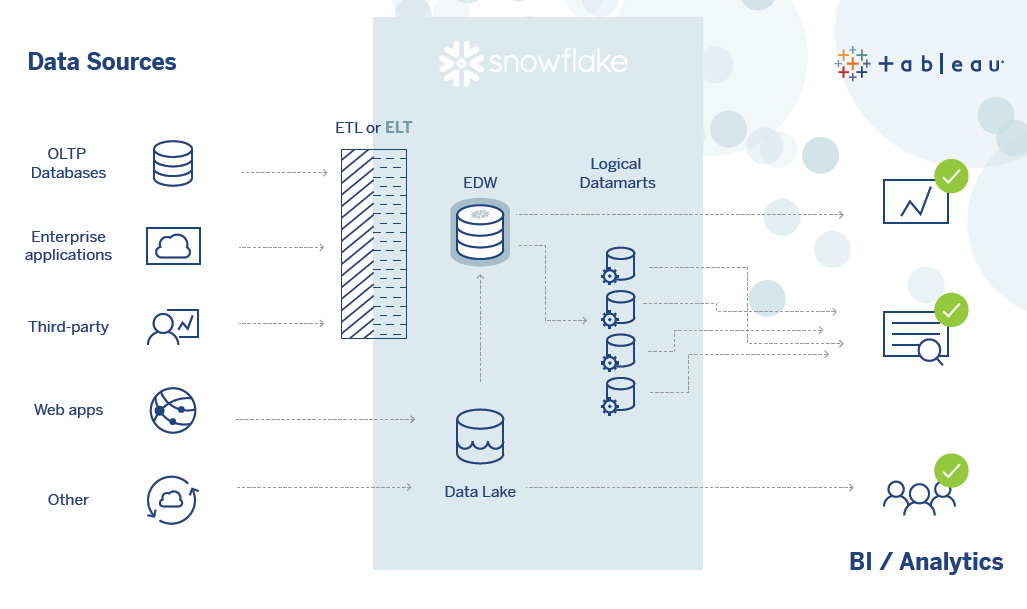
The Accelerated Analytics Quick Start with Tableau and Snowflake on the AWS Cloud to solve growing companies needs by streamlining the process of deploying and configuring Tableau Server and Snowflake.
Snowflake and Tableau are leading technologies that address the twin challenges of harnessing the ever-increasing volumes of varying data, and democratizing modern data analytics so all business users can extract valuable insight from that data.